


Debt Ceiling Deal – US avoids first ever government debt default
US President Joe Biden and Republican House Speaker Kevin Mccarthy reached a last minute agreement on Sunday, 28th May to raise the US debt ceiling. The deal suspends the $31.4 trillion debt ceiling until Jan. 1, 2025, allowing the U.S. government to pay its bills. The agreement includes spending caps for the federal budget in the first two years in 2024 and 2025, and then sets appropriations targets for the following four years.
The agreement, billed as the Fiscal Responsibility Act, has cleared key votes on the house floor on 31st May and needs to be approved by the Senate to take effect. Once approved, the bill would avoid a historic US government default and raise the nation’s debt ceiling.
US Debt Ceiling – What is it?
The US debt ceiling defines the maximum amount of money the US government can borrow to finance its bills. Since 2001, the US has run a budget deficit meaning that its revenues are not enough to cover its spending. The government borrows the difference by issuing bonds. When the debt ceiling is reached, the government cannot borrow more money and must find other ways to pay its bills or there is a risk of default. The debt ceiling has been raised or suspended many times before to avoid the US going into default.
What could have happened if the US debt ceiling was not raised?
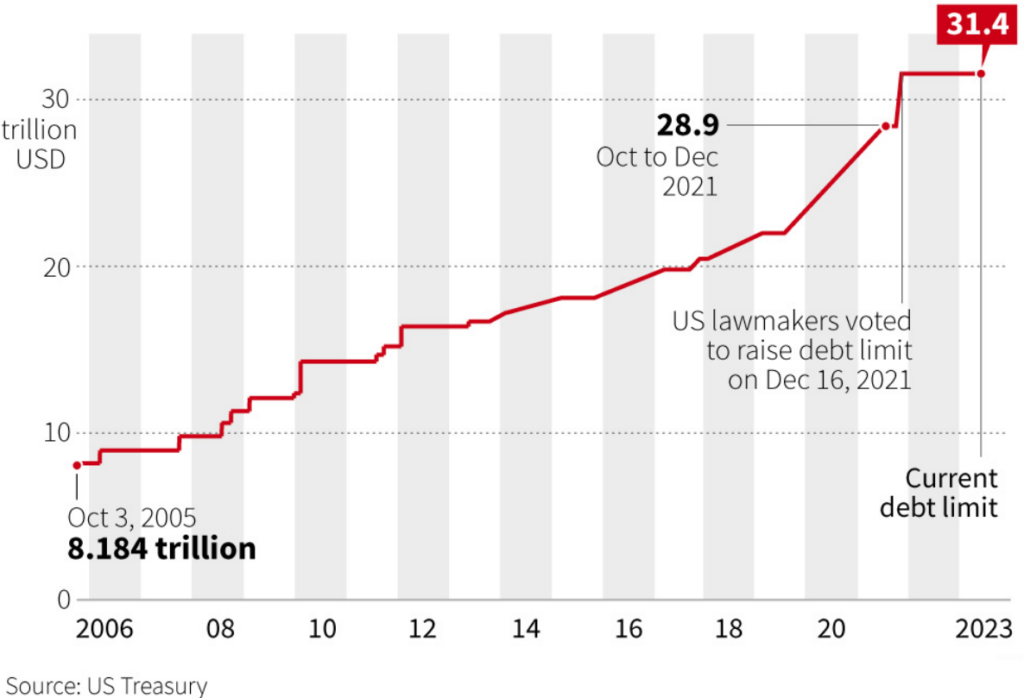
The current debt ceiling is at $31.4 trillion which was reached on Jan 19, 2023. Since then, the US treasury has been taking ‘extraordinary measures’ to finance its bills. But those measures were supposed to last till early June (the X-date). If the US congress was not able to raise the debt ceiling before that, it may have resulted in a financial crisis including the likely default of the US government debt.
And the consequences of a default are quite severe. Based on CEA simulations and analysis by Brookings, a brief or protracted default could have resulted in
- An immediate, sharp recession on the order of the Great Depression with the stock market plunging by 45%
- Unemployment spiking up from 3.5% to 5.0%, leading to over 2 million job losses
- Increase in borrowing rate by 25bps resulting in increase in federal borrowing costs by $750B in the next decade
Impact on interest rates during the debt ceiling brinkmanship
The political brinkmanship over the US debt ceiling and uncertainty around FED interest rate outlook led to sharp increases in interest rates across the treasury yield curve. This impacted bond prices negatively and corrections in portfolios having exposure to fixed income securities in the last two months. More specifically, yields on treasury bills maturing in June (just after the X-date) increased by close to 1.4% since mid April.
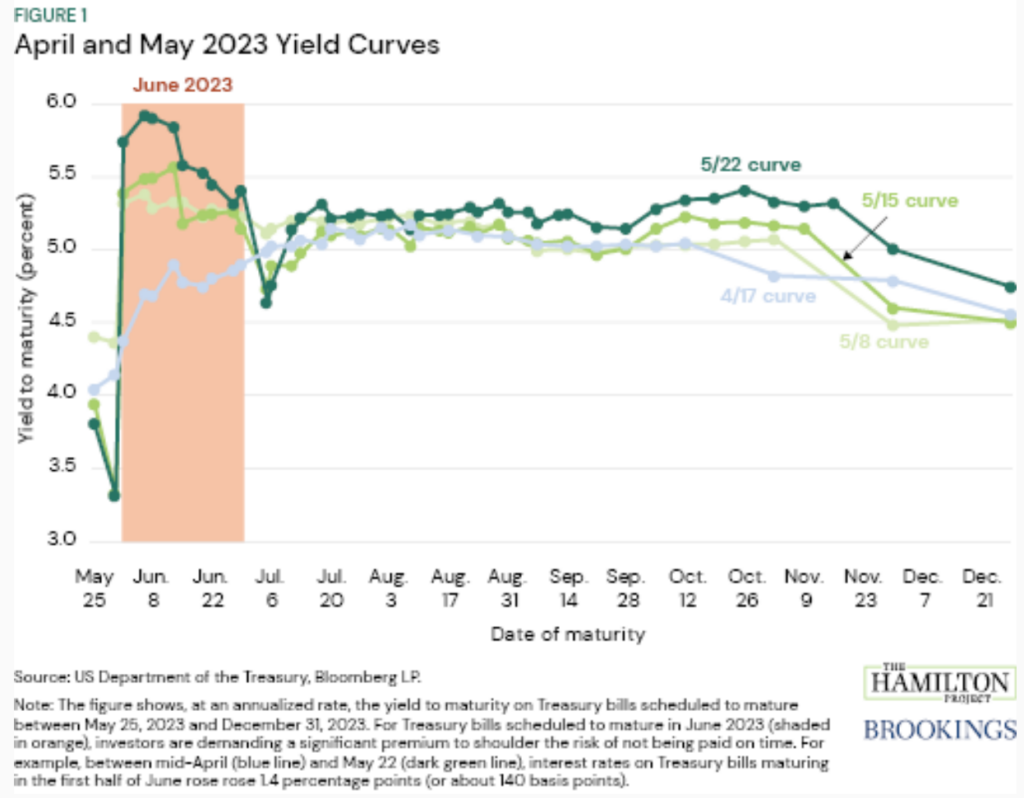
The chart above shows that between mid-April (blue line) and May 22 (dark green line), interest rates on Treasury bills maturing on June 1 rose from 4.4 percent to 5.7 percent. Even at the longer end of the curve, both the 2-year and 10-year treasury yields rose by at least 0.50% in the run up to the X-date.
Relationship between bond prices, rates and yield
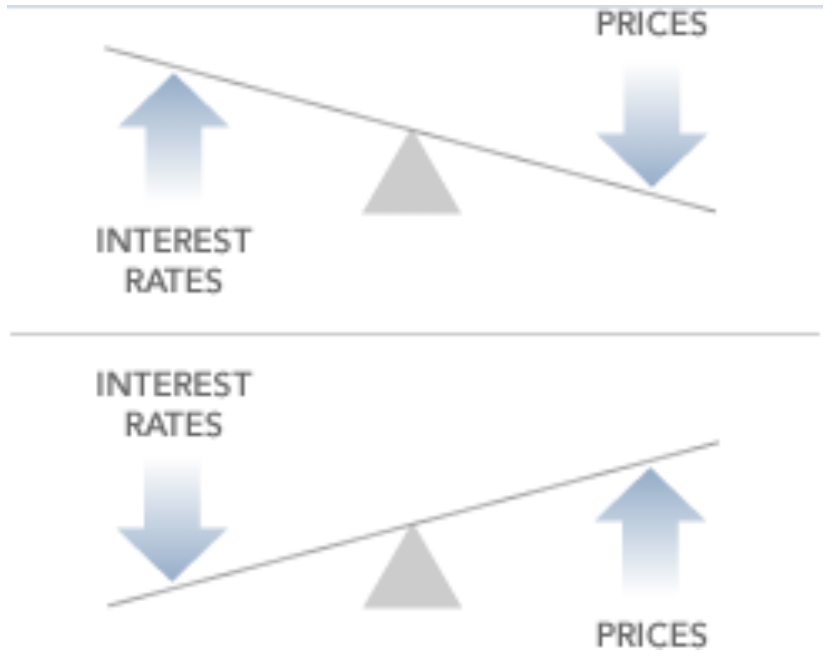
If you buy a bond at issuance, the bond price is the face value of the bond, and the yield will match the coupon rate of the bond. If you then hold the bond to maturity, typically changes in interest rates and yields do not impact you. But usually investors do not buy bonds at issuance or hold them to maturity. Similar to stocks, bonds can be bought and sold in the secondary market. The bond prices in the secondary market can be significantly impacted by the prevailing interest rates. When interest rates/yields increase, bond prices fall because new bonds are likely to be issued at these higher interest rates, making the older issued bonds less attractive unless they can be purchased at lower prices. The reverse is true when interest rates/yields fall.
Markets react positively to the US Debt Ceiling Deal
The markets have taken the news of the US debt ceiling deal positively with the treasury yields softening over the last one week and bond prices recovering. The equity market went through this phase relatively smoothly with the tech heavy NASDAQ popping nearly 6% in May on the back of an AI-fuelled rally.
With the debt ceiling hurdle being cleared, the focus shifts back to the FED and its interest rate policy. Currently, the market is pricing in a pause in the rate hike by the FED in its June meeting. There has been a dramatic shift within the last one day from a 66% probability of a 25 bps hike (FED target rate increases to 5.25-5.5%) on May 30th to a ~70% probability of no hike (FED target rate remains at 5.0-5.25%) currently on the back of the clearance of the debt deal.
The road ahead for the US economy
Overall, the US economy remains resilient with multiple recent positive economic data prints. The labor market threw a positive surprise with 10.1 million job openings in April after three months of decline. The US GDP also rose by 1.3% in Q1 2023 against an expected 1.1% and Personal Consumption Expenditures price index increased 4.4% for the 12 months ended in April, up from a 4.2% increase in March. The regional banking sector looks to be stabilised with fears of contagion calming down. Inflation expectations have also softened though it remains sticky at the current levels which means that while FED may pause further rate hikes, the prospects of rate cuts get pushed down further into early 2023.
What does it mean for investors?
In terms of near term outlook, this means equity markets may remain rangebound as interest rates continue to remain elevated. We believe equities, while currently fairly valued and may have limited near term upside, should remain the asset class of choice for long term growth needs of clients. On fixed income, “income” is finally back in fixed income with record high yields and the current state of the market provides compelling opportunities in fixed income investing from a risk-reward standpoint.

Investing involves risk, including the risk of losing your invested amount. Any information that may be in this communication is general in nature only and is current at the time of writing. Syfe does not make recommendations of any kind or provide personal advice that take into account your objectives, financial situations or needs. You should therefore consider the appropriateness of the information in light of your own objectives, financial situation or needs before acting on such information, and/or speak to your financial or tax adviser for personal advice. Past performance figures are based on information provided by third parties and may not be accurate. Any references to past performance and future indications are not, and should not be taken as, a reliable indicator of future results. Syfe does not intend for any statement made here to relate to the acquisition or disposal of any shares in the companies or other financial products named here. Syfe makes no representation and assumes no liability as to the accuracy or completeness of the content of this communication.


