
H2 2026 Outlook:
Build for Breadth, Against the Grain
True resilience is found beyond the crowded trades
TL;DR. The first half of 2026 is one for the books. An energy shock from the Iran War has rewritten the arc of inflation and interest rates, while a seismic technological shift rewires every corner of the modern economy. For investors, the halfway point offers an opportunity to review and reset – and build a more resilient portfolio that could withstand challenges ahead.
Overall, we think the second half of 2026 is the time to:
- Diversify, for real — beyond increasingly concentrated indices, crowded trades.
- Get selective in AI — Back the disciplined, disrupting monetisers over the disrupted and cash-strained spenders.
- Brace for the inflation bump — Ripples from the energy shock could keep prices sticky into year-end, before disinflationary forces reassert themselves.
- Capture income — Elevated yields open a rare chance to lock in income at levels unseen in years.
Markets at a Glance
Total returns H1 2026 vs full year 2025
Source: Bloomberg, July 2026. Returns in USD.
1. Avoid the crowd: Index hugging is not enough
Markets overcame extraordinary challenges to close H1 2026 near record highs. The rally ran on strong fundamentals – exceptional earnings growth, powered by AI. Even the Iran War, which briefly disrupted markets, could not derail the stock market’s upward grind. Q2 turned out to be the best quarter in six years for the S&P 500.
A closer look, however, reveals the underlying risks:
- AI’s dominance means half of US earnings growth is dependent on the tech sector. The 10 largest stocks are about 40% of the S&P 500. Korea and Taiwan together are half the market capitalisation in emerging markets (these two markets are themselves dominated by a couple of semiconductor stocks).
- This means buying the index – what once looked like diversified allocations – could give investors a level of concentration and volatility they never intended to get exposed to.
- Mega-cap dominance could entrench in the next 6-12 months. More “mega IPOs” are hitting the public market following SpaceX, and volatility remains a risk with feverish leveraged trading.
- For the top 10 stocks’ weight to fall to ~20% of the index, a level often seen before 2020, they will have to stay flat while the other 490 stocks rally over 160% – an implausible scenario.
Tech Powered the Rally
Bubble size represents weight in S&P 500
Source: J.P. Morgan Asset Management, July 2026.
Portfolio Implications: True diversification today requires breadth beyond the index – across geographies, asset classes and sources of return.
Rather than depending on passive index trackers, consider pairing complementary “smart” strategies that generate returns differently e.g. Core Equity100, which targets the factors – quality, value, momentum – that have historically driven outperformance.
- The breadth provided by these diversified strategies could prove crucial this year. H1 brought early signs of a rotation away from tech as investors took profit, into value and cyclical sectors (e.g. energy, industrials, financials).
- Regionally, we stay overweight emerging markets over developed – for stronger earnings growth and more reasonable valuations. China and India, whose combined GDP is nearly half of EM, offer breadth unavailable elsewhere in Asia, spanning cyclicals, consumer stocks and newly minted tech names.
Earnings impress, EM in the lead
EPS growth year-on-year across major markets
Sources: Capital Group, FactSet, MSCI, S&P Global. Estimated annual earnings growth is represented by the mean industry analyst consensus earnings per share estimates for the year ending December 2026 across the S&P 500 Index (U.S.), the MSCI Europe Index (Europe), the MSCI Japan Index (Japan), the MSCI EM Index (Emerging markets) and MSCI China Index (China). Earnings growth represented in USD. Estimates are as of May 31, 2026.
2. AI: Time to get selective
Underpinning equity strength is the accelerating AI build-out – capital expenditure on the chips, data centres and power the technology runs on. The numbers are staggering:
- Capex by the “hyperscalers” (the few big tech firms running the largest data centres) for 2026 has been revised up again to US$800bn, up from ~US$650bn at year-start
- Cumulative capex spend could reach ~US$14 trillion over roughly five years. For context, that’s about one-eighth of global GDP).
- Over 10 years, it is estimated to accelerate to US$30 trillion – exceeding even China’s 2000s investment boom, the largest in modern history. It’s already big enough to move macro, albeit modestly (est. +0.3pp US GDP 2026).
What markets care about though is not just today’s spending, but tomorrow’s impact. Investors in H1 largely favoured hardware over software, and disciplined monetisers with real earnings over cash-burning spenders. The rise of agentic AI wiped ~US$2 trillion off software stocks at one point, on fears that it will upend existing business models. Capex is taking ~94% of hyperscaler operating cash flow (vs ~50% norm). Some have turned to debt for funding.
Portfolio Implications: Selection matters more than ever as scrutiny on spending discipline intensifies.
- AI enablers over spenders: Capex is now taking ~94% of hyperscalers’ operating cash flow. We favour instead the “enabler” companies building the memory, logic, networking, and the heavy-asset, low-obsolescence infrastructure AI actually runs on, like power and data centres.
- Hardware caution: While we still want to own the chipmakers supplying the build-out, their extraordinary momentum means they now trade at a rich valuation relative to their own history – justified for now by genuine supply bottlenecks, but a premium that rests on how long that scarcity lasts.
- Software potential: Greater potential might be found in stocks that have already corrected this year. Following the “SaaSpocalypse” rout, some of the leading software stocks regained some momentum after tweaking their business models – shifting from charging per user to charging for the work their AI performs, so revenue holds up even as automation replaces headcount. Attractive valuations and improving earnings could give the more adaptive companies further support in H2.
The AI build-out is just beginning
Cumulative capex 2026-2030 (US$ trillions)
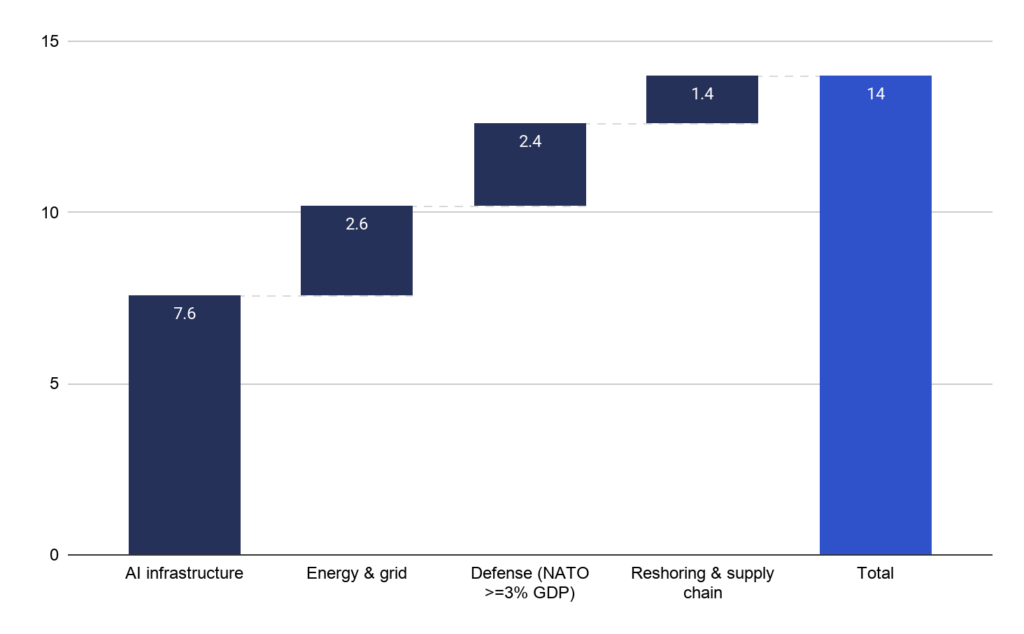
Source: PIMCO estimates based on IMF data, June 2026.
3. Inflation: Rewritten arc opens income opportunity
Inflation is the biggest upset of the year so far. Prices were set to fall in H1, with a softer economy and stronger productivity. Then came the Iran War. A historic energy shock that sent Brent up 50% to $120/barrel is creating repercussions even as the fighting concludes. US headline inflation reaching 4%, highest in about two years, as price passthroughs start to hit the consumer. Some analysts fear a repeat of 1970s-style “stagflation” (low growth, high inflation), made worse by policy mistakes and intense capital spending (in rearmament then, and AI now).
Against this backdrop, the US Federal Reserve shifted its priorities – from focusing on rescuing growth to keeping a lid on inflation. The first rate-setting meeting under new chair Kevin Warsh confirmed this: a hawkish hold, nine of eighteen decision-makers pencilling a hike by year-end. But Warsh also left room for manoeuvre, citing the lack of “conviction” in those views. The trajectory of inflation in H2 could yet change the Fed’s trajectory.
Our view is that the inflation bump could be short-lived:
- The energy shock is a one-off, and oil prices are already back at pre-war levels. Besides, energy is today a much smaller component of consumer prices than in the 70s.
- Shelter, which makes up about one-third of CPI, is 2 percentage points lower than a year ago as US rental vacancies rise.
- While the AI buildout is initially inflationary, its impact will be increasingly disinflationary with productivity gains.
All told, disinflation forces could be back in the driving seat by next year. The bar to hike this year remains high, and if markets grow cautious on the Fed’s warnings, financial conditions could tighten without the need for Fed action. As such, our base case is now a Fed hold through 2026, with the view that US interest rate cuts are delayed, not denied.
US inflation: Not all created equal
Energy price rise likely short-lived, shelter the opposite
Source: Bloomberg, July 2026.
Portfolio Implications: This presents a rare income opportunity. Starting yields are a strong predictor of forward returns, and they have now climbed to attractive levels (10-year US Treasury yields topped 4.5%). Compared to the last yield run-up in 2022, bond investors are taking much less interest rate risk (duration) with much higher return potential (yield to worst).
- We maintain our preference for the “belly” of the curve (in particular 5-7 year). These tenors offer almost as much income as long-dated bonds (>4%) with less sensitivity to rate moves.
- Reaching beyond 10-year is less enticing with long-term fiscal pressures in developed markets, especially amid a heavy H2 political calendar (e.g. US mid-terms, UK premiership change).
- At the short-end, global uncertainty and higher cash rates make the case for keeping more liquidity. But given bonds’ returns are starting to rival equities’ – with a fraction of the risk – sitting on too much cash comes with a substantial opportunity cost.
- Our Income+ offering is paying out 5-6% a year, well above local deposit and government bond rates of ~2-3%. The portfolio is actively managed by PIMCO, one of the world’s largest bond managers, and diversifies globally across high-quality government and corporate bonds.
A word on gold. With elevated rates, non-yielding bullion inevitably loses some shine. After years as the go-to geopolitical hedge, the trade has also become crowded and “high-beta”, tracking risk rather than offsetting it. So, while gold’s long-term store-of-value role stays intact and central banks could keep buying, near-term diversification benefits come at a discount.
Less Risk, Higher Income
Bloomberg US Aggregate Index
Source: Bloomberg US Aggregate Index, Capital Group, as of 31 May 2026. YTW represents the lowest income investors would get bar a default. Duration represents sensitivity to interest rates i.e. In 2022, a 1% rise in interest rates would have led to a decrease in value by about 6.84%. In 2026, that same 1% increase would only cause a 5.98% drop.
4. The view from Hong Kong: Asia/EM for growth and income
Beyond the crowded Korea and Taiwan equity trades, China offers AI beneficiaries across software and hardware, plus cyclicals that benefit from policy stimulus. India presents a catch-up story, with earnings and economic growth stabilising and valuations once again appealing. Japan benefits from the additional capital investments. All three, as net energy importers, gain from the lifting of the oil overhang. Here in Hong Kong, the economy remains resilient thanks to a mix of wealth inflows, strong IPO pipeline, and strong retail and tourism activities.
Portfolio Implications: Profiting from Asia’s growth takes the right positioning – particularly in China.
- Growth is on track (5% in Q1) but the economy is increasingly “K-shaped”. Exports, powered by chips and computers, hit record levels while retail sales lagged as the lacklustre property market – which stores so much household wealth – weighed on consumption. Policymakers have been cautious and paused easing amid the oil shock and expected tightening of global financial conditions.
- Within tech, we like the onshore-listed names – semiconductors, power, advanced manufacturing – as direct AI build-out beneficiaries. The software-dominant offshore market is more vulnerable to AI’s disruptions, but the sell-off in H1 has created attractive entry points and they could gain ground on rising cloud revenues.
Tracking the US, Hong Kong rates will likely remain elevated – and helped higher by tightening local liquidity due to a busy IPO market and increasing bond issuance by the government to fund infrastructure projects. Given our view that Fed cuts are delayed, not denied, H2 2026 may present an opportune window for HK investors to lock in income.
Disclaimer:
This article is for informational purposes only and should not be viewed as financial advice. It is not meant to market any specific investment, or offer or recommend the purchase or sale of any specific security. All forms of investments carry risks, including the risk of losing all of the invested amount. Such activities may not be suitable for everyone. Past returns are not a guarantee for future performance. Investors should consider his/her own circumstances. The information or advertisement contained herein does not constitute an offer, any solicitation, invitation or recommendation to engage in any investment activities. The content of this article has not been reviewed by the Securities and Futures Commission of Hong Kong.Cash+ Fixed HKD is an investment management service, and should not be taken as a collective investment scheme or a deposit or savings account. The optimised rates are not due to pooling of invested funds by Syfe, and Syfe is not offering Cash+ Fixed HKD as a fund, scheme, or portfolio with a pooling element. Until the investment starts, the return rate is subject to change. Cash+ Fixed HKD returns are fixed, subject to underlying bank risk. All Cash+ Fixed hkd returns are only available after maturity. [Learn more]