

Syfe REIT+ – Invest in Singapore’s Top properties
Get direct exposure to Singapore’s top SGX-listed real estate investment trusts (REITs) and earn dividends.
Sign up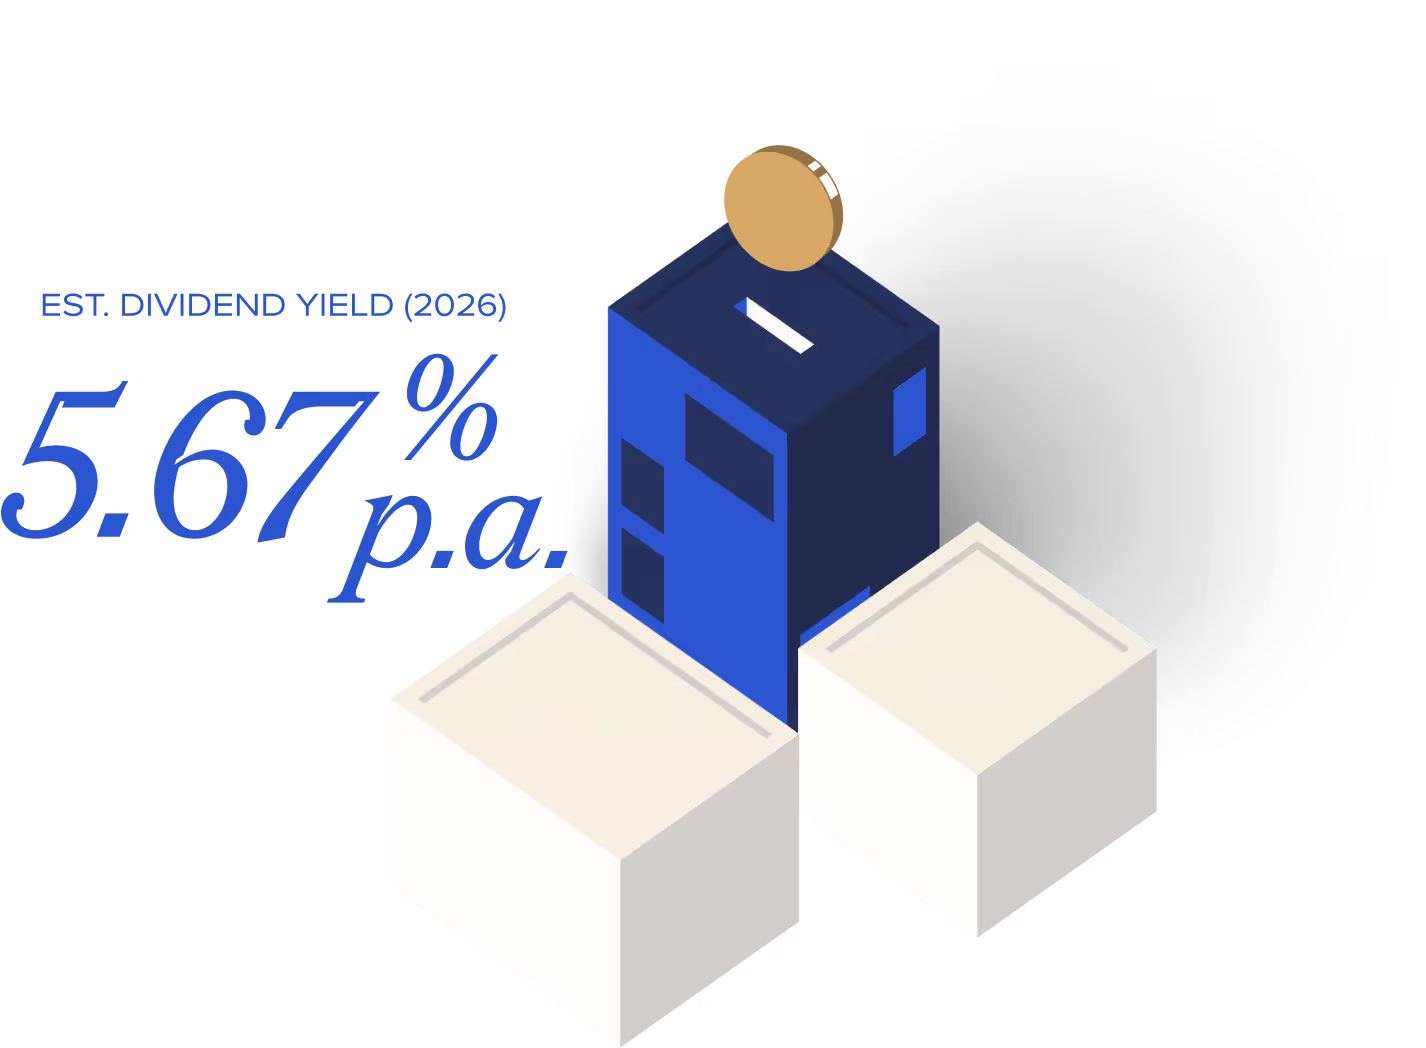
.avif)
%20(1).avif)

Why Syfe?
security
Syfe is regulated by the MAS. We are licensed under the Capital Markets Services ("CMS") License (CMS License No: CMS100837).
Simplicity
Our platform is user-friendly and easy to use. You can set up auto-investing and grow your wealth without lifting a finger.
Accessibility
You can choose from a range of different portfolios tailored to your risk appetite.
Portfolios at a glance
Purpose-built solutions for all your income needs in any market condition.
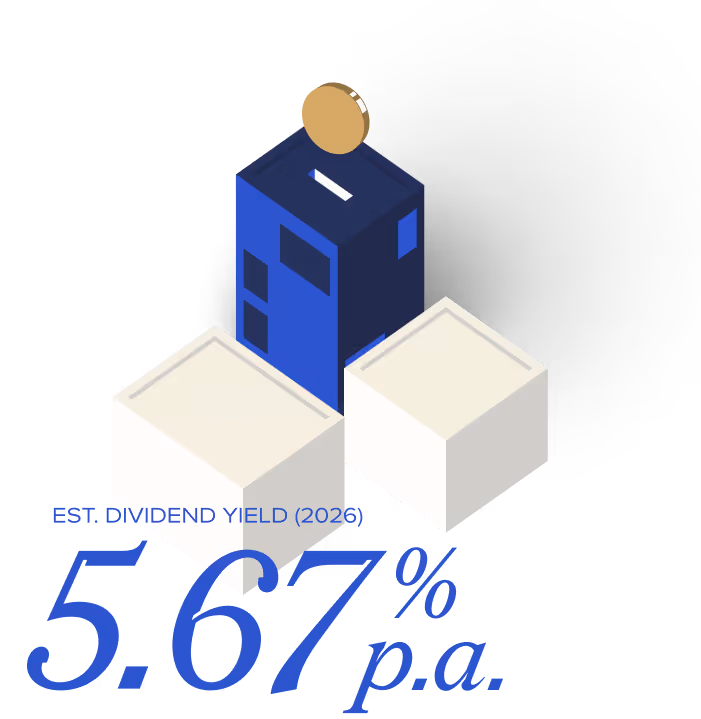
Monthly payout ranges are computed based on the weighted average of the annualised historical distribution amount or dividend/distribution yield of the constituent funds from the latest three months. The upper and lower bounds of the range are rounded up to the higher 0.5% and down to the lower 0.5% respectively. The dividend amount or dividend yield of the constituent funds is not guaranteed. Past distributions are not necessarily indicative of future trends, which may be lower. A positive monthly payout or distribution yield does not imply a positive return.
Learn moreEstimated Yield to Maturity (YTM) of a bond is the total return that an investor stands to receive if all scheduled payments are made on time and the bond is held until maturity. Estimated YTM of the portfolio is the weighted average of the YTM of the bonds held in the constituent funds in the portfolio. Estimated YTM is reported gross of fees, the deduction of which will reduce the yield. It does not represent the portfolio's return. For instruments such as SSBs, T-Bills and FDs, the yields are fixed at the onset and represent the total return if held to maturity.
Learn moreMonthly payout ranges are computed based on the weighted average of the annualised historical distribution amount or dividend/distribution yield of the constituent funds from the latest three months. The upper and lower bounds of the range are rounded up to the higher 0.5% and down to the lower 0.5% respectively. The dividend amount or dividend yield of the constituent funds is not guaranteed. Past distributions are not necessarily indicative of future trends, which may be lower. A positive monthly payout or distribution yield does not imply a positive return.
Learn moreEstimated Yield to Maturity (YTM) of a bond is the total return that an investor stands to receive if all scheduled payments are made on time and the bond is held until maturity. Estimated YTM of the portfolio is the weighted average of the YTM of the bonds held in the constituent funds in the portfolio. Estimated YTM is reported gross of fees, the deduction of which will reduce the yield. It does not represent the portfolio's return. For instruments such as SSBs, T-Bills and FDs, the yields are fixed at the onset and represent the total return if held to maturity.
Learn more
Comparing portfolios
Investors should consider the investment objectives, risks, charges and expenses of the constituent funds carefully before investing. This and other information is contained in the constituent funds’ prospectus. Please read the constituent funds’ prospectus carefully before you invest or send money. Past performance is not a guarantee or a reliable indicator of future results and no guarantee is being made that similar returns will be achieved in the future.
Learn moreEstimated Yield to Maturity (YTM) of a bond is the total return that an investor stands to receive if all scheduled payments are made on time and the bond is held until maturity. Estimated YTM of the portfolio is the weighted average of the YTM of the bonds held in the constituent funds in the portfolio. Estimated YTM is reported gross of fees, the deduction of which will reduce the yield. It does not represent the portfolio's return. For instruments such as SSBs, T-Bills and FDs, the yields are fixed at the onset and represent the total return if held to maturity.
Learn moreMonthly payout ranges are computed based on the weighted average of the annualised historical distribution amount or dividend/distribution yield of the constituent funds from the latest three months. The upper and lower bounds of the range are rounded up to the higher 0.5% and down to the lower 0.5% respectively. The dividend amount or dividend yield of the constituent funds is not guaranteed. Past distributions are not necessarily indicative of future trends, which may be lower. A positive monthly payout or distribution yield does not imply a positive return.
Learn moreDuration is a measure of the sensitivity of the price of a bond to a change in interest rates. Generally, the higher a bond’s duration, the more its value will fall as interest rates rise, because when rates go up, bond values fall and vice versa. Duration of the portfolio is the weighted average of the duration of the individual bonds held in the constituent funds of the portfolio.
Learn moreCredit quality gives a snapshot of the portfolio's overall credit quality. It is an average of each bond's credit rating held in the constituent funds, adjusted for its relative weighting in the portfolio.
Learn moreBeta vs S&P 500 measures the volatility of the returns of the portfolio against the broader market (S&P 500). It is a measure of risk and allows investors to gauge how sensitive the portfolio might be to macro market risks. For positive equity beta below 1, a lower equity beta value implies lesser risk as it denotes lesser positive correlation to the broader market while a higher value implies greater risk.
Learn more100% REITS | REITS with risk MGMT | |
|---|---|---|
Objective | Higher yield with capital appreciation | Steady yield with capital appreciation |
Estimated dividend yield (2025) | 5.65 % | 3.42 % |
Returns (2025) | 4.33 % | 4.69 % |
asset allocation | 100% REITs | Minimum 50% REITs. Remaining in Singapore Government Bonds. |
Risk rating | High | Moderate high |