
Thought Of The Week
US Infrastructure Bill
After a long standoff last Friday, the House passed a USD 1 trillion infrastructure bill with a vote of 228-206. Notably, a significant amount of USD 550 billion has been dedicated to transport projects, utilities and broadband. This led construction stocks to sharply spike on Monday. Caterpillar and Vulcan Materials was up nearly 5% while asphalt maker Astec industries was up over 14% on Monday. With the passing of the infrastructure bill, all eyes are now set on the social safety net and climate change bill at USD 1.75 trillion. If passed, the social safety net bill would be the largest expansion of the social safety net since the 1960s. However, it is striking that the lack of party unity amongst the Democrats could jeopardize the passing of the social safety net and climate change bill.
Inflation
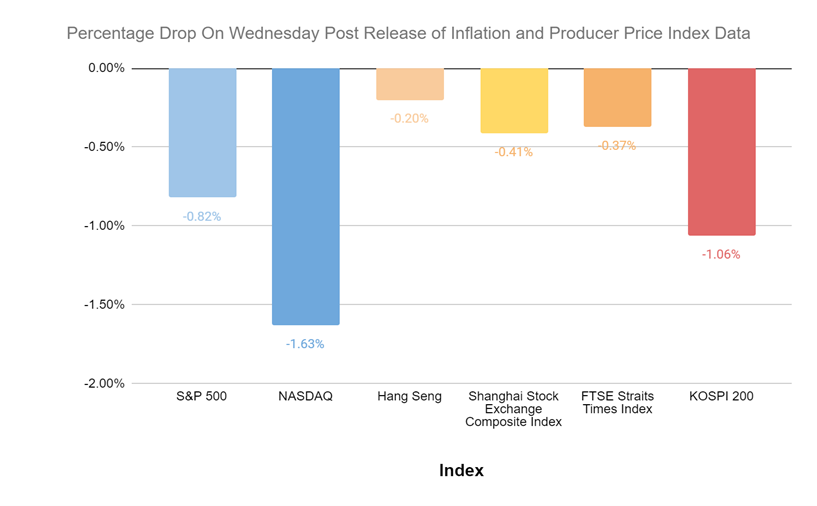
US inflation hit a 30 year high with the annual rate of inflation coming in at 6.2%. This was driven by the reopening of the economy, supply chain bottlenecks and a massive COVID stimulus amongst many factors. Correspondingly, short term bond yields rose which suggests bond investors anticipate the Federal Reserve to quickly raise interest rates despite the Federal Reserve showing no urgency last week. Despite overhanging inflation concerns, the US markets seem to have proved resilient as a whole. This could be attributed to US companies successfully passing on the cost to consumers. Furthermore, as long as the Federal Reserve does not tighten the monetary policy (by raising interest rates), high inflation may not spell bad news for stocks. However, with inflation running high, there is some expectation that interest rates will sit higher. This would affect growth stocks with distant cash flow projections. Hence, the technology heavy NASDAQ pulled back heavily on Wednesday with a -1.63% drop.
China’s Producer Price Index (PPI) for the month of October came in at 13.5% – higher than the forecasted 12.5% polled by The Wall Street Journal. The PPI is also the highest since 1996 when China first started releasing data. The high PPI was primarily driven by high energy and material prices. High PPI could potentially further add to global inflationary pressure. Global inflationary fears caused the Asian markets to pull back on Wednesday with Hong Kong, Shanghai, Singapore and Korea markets ending the day in negative territory.
The high PPI was sharply contrasted with only a moderate increase in China inflation. China inflation only stood at 1.5% in October – well below the 3% official target. This means that Chinese producers are not passing on the production price increase to consumers for now. With regard to inflation and PPI data, economists had conflicting views on China’s monetary policy. Some argued that a lower inflation gave room for easing monetary policy while others noted pricing pressures could keep an ease of monetary policy at bay. Post PPI and inflation announcements, China 10 year bond yield stood little changed at 2.95% indicating market sentiment leaning towards the latter view.
Chart Of The Week
Index performance post-inflation data release
Important Information and Disclosure
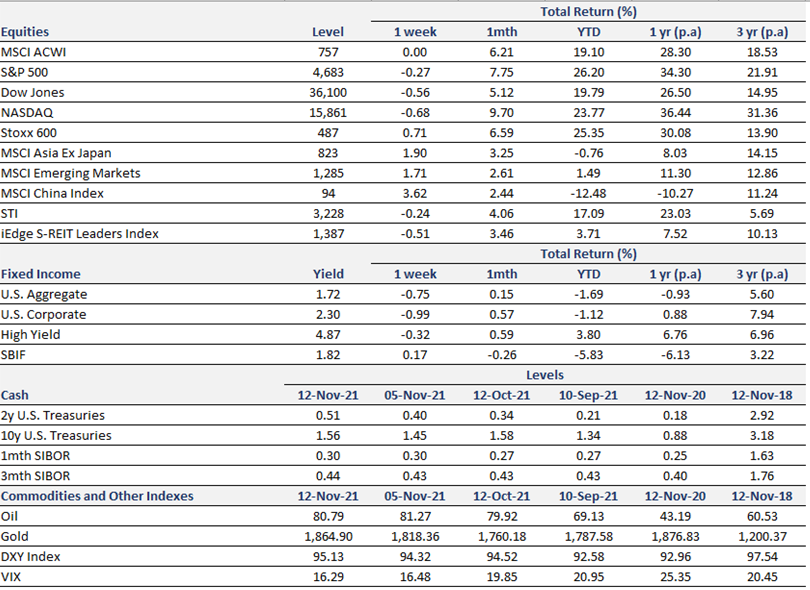
Equity Price Level and Returns: All returns represent the total return for stated period. MSCI ACWI: Global equity index provided by Morgan Stanley Capital International (MSCI). S&P 500: Market capitalization index of U.S stocks provided by Standard & Poor’s (S&P). Dow Jones: Price-weighted index of U.S stocks provided by S&P. NASDAQ: Market capitalization index of U.S stocks provided by NASDAQ. Stoxx 600: Market capitalization index of stocks listed in European region. MSCI Asia Ex Japan: Asia excluding Japan equity index provided by MSCI. MSCI EM: Emerging markets equity index provided by MSCI. SSE: Capitalization weighted index of all A-shares and B-shares listed on Shanghai Stock Exchange. STI: Market capitalization index of stocks listed on Singapore Exchange. SREITLSP: Market capitalization index of the most liquid real estate investment trusts in Singapore.
Fixed Income Yield and Returns: All returns represent total
return for stated period. Global Aggregate: Global investment grade debt from both developed and emerging markets issuers. U.S. Aggregate, U.S Corporate, High Yield provided by Bloomberg Barclays Indices, ICE Data Services & WSJ. SBIF: ABF Singapore bond index fund provided by Nikko AM.
Key Interest Rates: 2-Year U.S Treasuries, 10 Year Treasuries, Bloomberg. 1-month, 3-month SIBOR: Singapore Interbank Offered Rates provided by Association of Banks in Singapore (ABS). Oil (WTI): Global oil benchmark, Bloomberg. Gold: Gold Spot USD/Oz, Bloomberg. DXY Index: U.S. Dollar Index, Bloomberg. VIX: Expectation of volatility based on S&P index options provided by Chicago Board Options Exchange (CBOE).
The information provided herein is intended for general circulation and/or discussion purposes only. It does not account for the specific investment objectives, financial situation or needs of any individual. The information in this document is not intended to constitute research analysis or recommendation and should not be treated as such.
This does not constitute an offer or solicitation to buy/sell any financial instrument or to participate any investment strategy. No representation or warranty whatsoever (without limiting to accuracy, usefulness, adequacy, timeliness or completeness) in respect of any information (without limiting to any statement, figures, opinion, view or estimate). Syfe does not undertake an obligation to update the information or to correct any inaccuracy that may become apparent at a later time. All information presented is subject to change without notice. Syfe shall not be responsible or liable for any loss or damage whatsoever arising directly or indirectly as a result of any person acting on any information provided herein.
The information provided herein may contain projections or other forward-looking statement regarding future events or future performance of countries, assets, markets or companies. Actual events or results may differ materially. Past performance figures are not necessarily indicative of future of likely performance. Any reference to any specific company, financial product or asset class in whatever way is used for illustrative purposes only and does not constitute a recommendation. Investors should note that there are necessarily limitations and difficulties in using any graph, chart, formula or other device to determine whether or not, or if so, when to, make an investment. The contents hereof are considered proprietary information and may not be produced or disseminated in whole or in part without Syfe’s written consent.

You must be logged in to post a comment.