
Thought Of The Week
U.S Politics: Infrastructure Program & Debt Ceiling
The House Democrats delayed voting on the administration’s $1.2 trillion infrastructure program on Thursday, the second time they have delayed a scheduled vote on the legislation. The bill faced opposition from progressive Democrats who do not want to vote for it until the Senate has passed the broader social policy bill worth $3.5 trillion while moderate Democrats wanted to sharply reduce the spending plan, resulting in a week-long of intra-party drama in the House. The infrastructure bill would fund improvements to roads, bridges, ports and expanded broadband internet access.
Meanwhile, U.S President Joe Biden signed a nine-week stopgap funding bill to avert a government shutdown. The legislation was hastily passed at the last minute before the 1st October deadline as a shutdown would trigger furloughs for hundreds of thousands of federal workers. Democrats had initially sought to attach a suspension of the debt ceiling to the funding bill but was refused by Republicans. Despite the continuing partisan battle over the debt, the debt ceiling has done little to contain the rising debt although investors do not believe that it would lead to a U.S default. Rather, it is just another political weapon that Republicans use to force spending cuts in programs they oppose.
10y Treasuries edged higher and the dollar added to gains for the week. Crude oil closed the month almost 10% higher after China was said to order its top energy companies to secure energy supplies at all costs amid shortages, prompting the White House to reiterate its own concerns over rising prices.
Fundamentals and Fluctuations
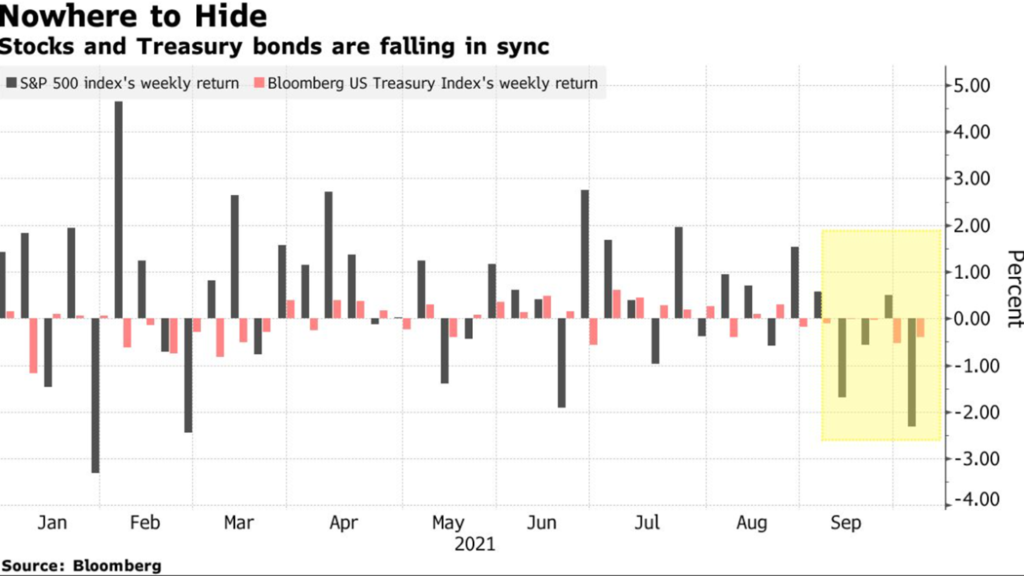
After a long stretch of gains for the stock market this year, September was the month when percolating investor anxiety finally came to a head, forcing major indexes lower. The MSCI All Country World Index fell 4.0% while the S&P 500 and MSCI Asia Ex Japan fell 3.59% and 5.24% respectively month-on-month. The world’s media rushed to attribute the sour performance with various reasons – Fed policy, U.S debt ceiling, inflation concerns, Chinese property contagion risk, slowing economic growth etc. The combination of these factors not only knocked the stock market off its winning streak, but it has also derailed some investors from their investment plan especially the newer ones who are not used to the (healthy) volatility after a long calm stretch in the markets.
Given the headwinds and unresolved issues, the stock market is expected to be choppy in the fourth quarter while posting modest gains. Investors should stay invested in a well-diversified portfolio with an emphasis on quality companies that have a strong record of delivering profits regardless of whether growth is slowing or accelerating due to their competitive advantage over their peers.
Chart Of The Week
Important Information and Disclosure
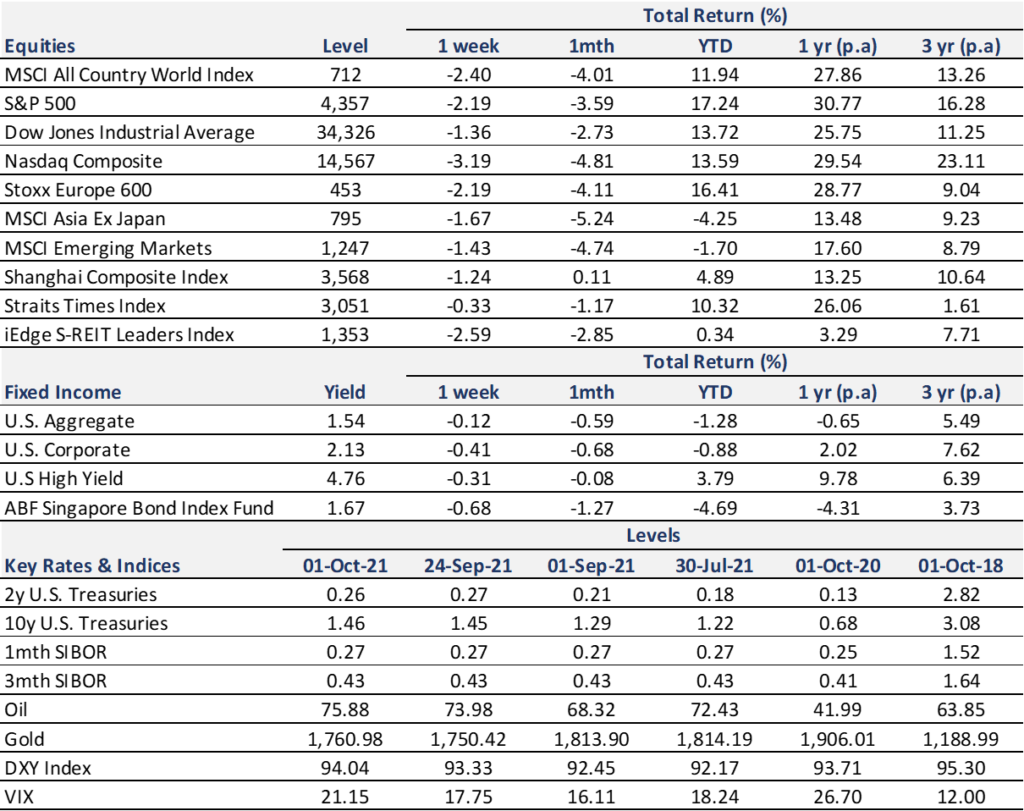
Equity Price Level and Returns: All returns represent the total return for stated period. MSCI ACWI: Global equity index provided by Morgan Stanley Capital International (MSCI). S&P 500: Market capitalization index of U.S stocks provided by Standard & Poor’s (S&P). Dow Jones: Price-weighted index of U.S stocks provided by S&P. NASDAQ: Market capitalization index of U.S stocks provided by NASDAQ. Stoxx 600: Market capitalization index of stocks listed in European region. MSCI Asia Ex Japan: Asia excluding Japan equity index provided by MSCI. MSCI EM: Emerging markets equity index provided by MSCI. SSE: Capitalization weighted index of all A-shares and B-shares listed on Shanghai Stock Exchange. STI: Market capitalization index of stocks listed on Singapore Exchange. SREITLSP: Market capitalization index of the most liquid real estate investment trusts in Singapore.
Fixed Income Yield and Returns: All returns represent total return for stated period. Global Aggregate: Global investment grade debt from both developed and emerging markets issuers. U.S. Aggregate, U.S Corporate, High Yield provided by Bloomberg Barclays Indices, ICE Data Services & WSJ. SBIF: ABF Singapore bond index fund provided by Nikko AM.
Key Interest Rates: 2-Year U.S Treasuries, 10 Year Treasuries, Bloomberg. 1-month, 3-month SIBOR: Singapore Interbank Offered Rates provided by Association of Banks in Singapore (ABS). Oil (WTI): Global oil benchmark, Bloomberg. Gold: Gold Spot USD/Oz, Bloomberg. DXY Index: U.S. Dollar Index, Bloomberg. VIX: Expectation of volatility based on S&P index options provided by Chicago Board Options Exchange (CBOE).
The information provided herein is intended for general circulation and/or discussion purposes only. It does not account for the specific investment objectives, financial situation or needs of any individual. The information in this document is not intended to constitute research analysis or recommendation and should not be treated as such.
This does not constitute an offer or solicitation to buy/sell any financial instrument or to participate any investment strategy. No representation or warranty whatsoever (without limiting to accuracy, usefulness, adequacy, timeliness or completeness) in respect of any information (without limiting to any statement, figures, opinion, view or estimate). Syfe does not undertake an obligation to update the information or to correct any inaccuracy that may become apparent at a later time. All information presented is subject to change without notice. Syfe shall not be responsible or liable for any loss or damage whatsoever arising directly or indirectly as a result of any person acting on any information provided herein.
The information provided herein may contain projections or other forward-looking statement regarding future events or future performance of countries, assets, markets or companies. Actual events or results may differ materially. Past performance figures are not necessarily indicative of future of likely performance. Any reference to any specific company, financial product or asset class in whatever way is used for illustrative purposes only and does not constitute a recommendation. Investors should note that there are necessarily limitations and difficulties in using any graph, chart, formula or other device to determine whether or not, or if so, when to, make an investment. The contents hereof are considered proprietary information and may not be produced or disseminated in whole or in part without Syfe’s written consent.

You must be logged in to post a comment.