
Thought Of The Week
Blue Sweep, Reflation Trade, Pro-Trump Mob
Democrats won control of the US Senate with two Georgia victories on Wednesday, giving incoming president Joe Biden control of both Senate and House of Representatives.
The two run-off elections were triggered after no candidate managed to win more than 50% during the Nov 3 election. Banks, materials and energy shares jumped higher this week as investors are now expecting larger stimulus and infrastructure bill to be passed through with a unified Democratic Party.
10y US Treasury yield also hit above 1% since March (yields rise when bond prices fall) as the prospect of more stimulus could feed through inflation. However, President Donald Trump continues to reject his defeat and even stoked anger among his supporters with his baseless allegations, resulting in a violent mob at the US Capitol with protesters roaming the legislative chambers and ransacking lawmakers’ offices. Lawmakers have since called for Trump to be removed from office before 20th January by invoking the 25th amendment if he is “unable to discharge the powers and duties of his office”.
To List or Not to List
After backtracking on plans to delist 3 Chinese state-run telecoms namely China Mobile, China Telcom and Chinese Unicom, New York Stock Exchange (NYSE) reversed course again and said that it would proceed with the delistings next week. The back-and-forth created confusion in Washington and Wall Street as the Chinese telecoms saw their shares whipsawed over the past trading sessions.
The execution order to ban US investments in Chinese companies with suspected military ties was announced last year by the Trump administration to further crack down on Beijing’s threat to the national security. The plot thickens following reports that Alibaba and Tencent could be added to the US blacklist which may result in huge implications in capital markets considering the size of their combined market capitalization of US$1.4 trillion. However, with the days remaining for Trump administration, more details will be needed to assess the impact and if a turning point could be in sight with Biden administration.
Asia in Focus, China remains a Standout
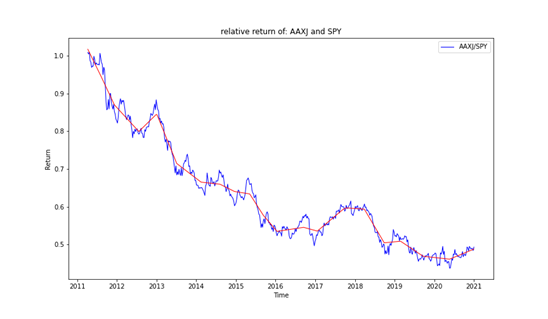
For the last decade, US has been the key driving force behind the longest bull run in history. However, it is worth noting that a reversal seems to have emerged at the start of 2020 where the relative return of MSCI All Country Asia ex Japan (AAXJ) to S&P 500 (SPY) started to tick upwards.
In Asia, many economies are already in the recovery mode with China leading the way. This is largely due to Asian countries implementing well-designed pandemic response measures including credit support and fiscal stimulus instead of cutting rates aggressively.
Looking deeper into Asia, China remains a standout opportunity as GDP growth is projected to jump to 8% in 2021 driven by stronger exports, improving domestic consumption and investment. Chinese government bonds also provide compelling risk-reward trade-off due to its attractive real yields, low correlation to global markets and the backing from the world’s net creditor. Having allocation to Asia especially China will be a strategic long-term positioning as Asia evolves as the world’s key growth driver while benefitting from the rebound in 2021.
Chart Of The Week
Relative return of AAXJ and SPY
Important Information and Disclosure
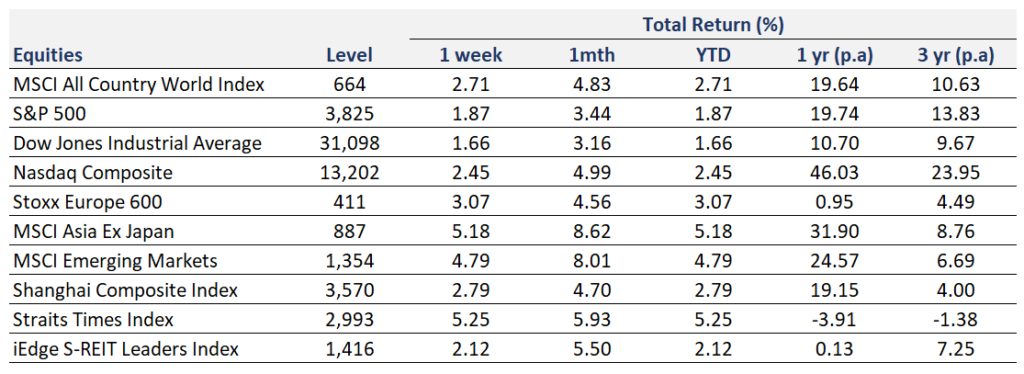
Equity Price Level and Returns: All returns represent the total return for stated period. MSCI ACWI: Global equity index provided by Morgan Stanley Capital International (MSCI). S&P 500: Market capitalization index of U.S stocks provided by Standard & Poor’s (S&P). Dow Jones: Price-weighted index of U.S stocks provided by S&P. NASDAQ: Market capitalization index of U.S stocks provided by NASDAQ. Stoxx 600: Market capitalization index of stocks listed in European region. MSCI Asia Ex Japan: Asia excluding Japan equity index provided by MSCI. MSCI EM: Emerging markets equity index provided by MSCI. SSE: Capitalization weighted index of all A-shares and B-shares listed on Shanghai Stock Exchange. STI: Market capitalization index of stocks listed on Singapore Exchange. SREITLSP: Market capitalization index of the most liquid real estate investment trusts in Singapore.
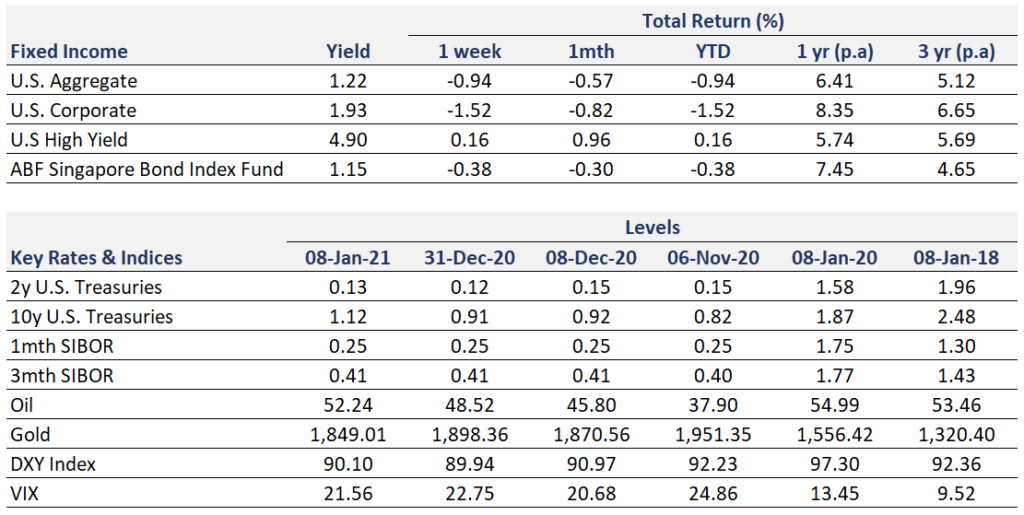
Fixed Income Yield and Returns: All returns represent total return for stated period. Global Aggregate: Global investment grade debt from both developed and emerging markets issuers. U.S. Aggregate, U.S Corporate, High Yield provided by Bloomberg Barclays Indices, ICE Data Services & WSJ. SBIF: ABF Singapore bond index fund provided by Nikko AM.
Key Interest Rates: 2-Year U.S Treasuries, 10 Year Treasuries, Bloomberg. 1-month, 3-month SIBOR: Singapore Interbank Offered Rates provided by Association of Banks in Singapore (ABS). Oil (WTI): Global oil benchmark, Bloomberg. Gold: Gold Spot USD/Oz, Bloomberg. DXY Index: U.S. Dollar Index, Bloomberg. VIX: Expectation of volatility based on S&P index options provided by Chicago Board Options Exchange (CBOE).
The information provided herein is intended for general circulation and/or discussion purposes only. It does not account for the specific investment objectives, financial situation or needs of any individual. The information in this document is not intended to constitute research analysis or recommendation and should not be treated as such.
This does not constitute an offer or solicitation to buy/sell any financial instrument or to participate any investment strategy. No representation or warranty whatsoever (without limiting to accuracy, usefulness, adequacy, timeliness or completeness) in respect of any information (without limiting to any statement, figures, opinion, view or estimate). Syfe does not undertake an obligation to update the information or to correct any inaccuracy that may become apparent at a later time. All information presented is subject to change without notice. Syfe shall not be responsible or liable for any loss or damage whatsoever arising directly or indirectly as a result of any person acting on any information provided herein.
The information provided herein may contain projections or other forward-looking statement regarding future events or future performance of countries, assets, markets or companies. Actual events or results may differ materially. Past performance figures are not necessarily indicative of future of likely performance. Any reference to any specific company, financial product or asset class in whatever way is used for illustrative purposes only and does not constitute a recommendation. Investors should note that there are necessarily limitations and difficulties in using any graph, chart, formula or other device to determine whether or not, or if so, when to, make an investment. The contents hereof are considered proprietary information and may not be produced or disseminated in whole or in part without Syfe’s written consent.

You must be logged in to post a comment.