
Thought Of The Week
Global Recovery
There is more evidence of the global economic bounce-back. U.S economic data released on Thursday showed strong gains in retail spending and unemployment benefits hitting the lowest since the pandemic. The rebound in demand for goods are largely attributable to businesses reopening, increased vaccination rates and a temporary spending boost from the latest round of stimulus checks.
As the economy continues to reopen, consumers may steer away from retail spending and move toward travel and services where there is higher pent-up demand, leading to more moderate retail sales.
Meanwhile, Chinese economic data also showed strength for the first quarter which puts it on course to join the U.S as twin engines for a global recovery in 2021. Based on a two-year average growth, which removes distortions caused by last year’s lockdowns, China’s GDP rose 5% in the first quarter and consumer spending expanded. The string of positive economic figures pushed the MSCI All-Country World Index to a fresh record this week with S&P headed for its sixth weekly gains.
Cryptocurrency Exchange, Big Banks Earnings
Coinbase Global Inc., a digital currency exchange which allows users to trade Bitcoin, Ethereum, and a few dozen other cryptocurrencies, made its stock market debut on Wednesday, which saw its market capitalization peaked at more than $112 billion before pulling back to close at $86 billion on the first trading session.
Despite the whipsawing due to lingering concerns over their volatility and usefulness as a payment method, Coinbase’s listing confirms that the acceptance of digital currencies is gathering pace but attention from regulators is also poised to intensify.
Meanwhile, first quarter earnings season kick off with the U.S banks reporting strong quarterly results, especially in the investment banking and trading divisions where the market for initial public offerings (IPOs) and special purpose acquisition companies (SPACs) boomed. With the recovery underway, credit conditions will continue to improve with demand for loans picking up and potentially benefitting from the impact of rising bond yields.
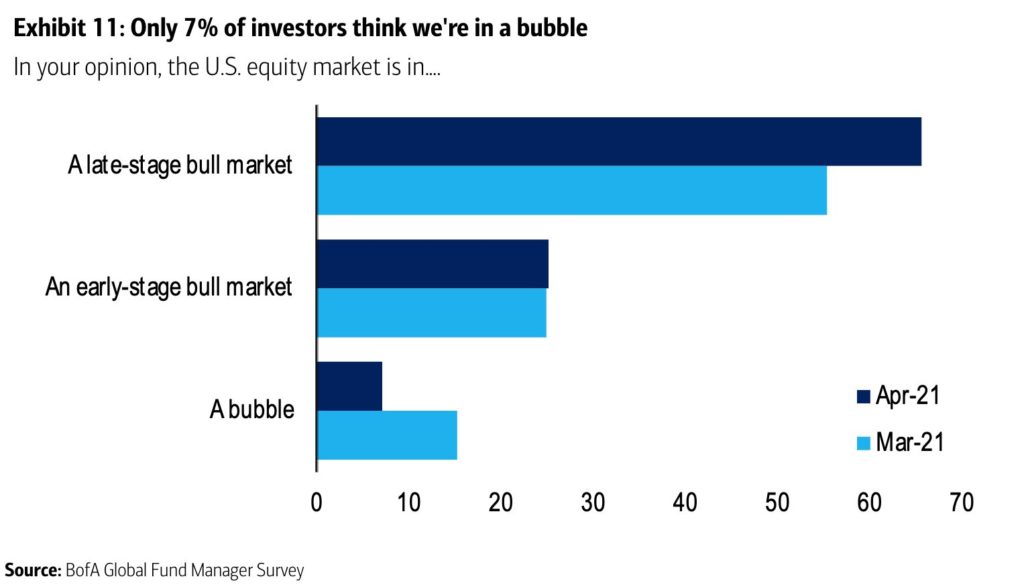
VIX at Pandemic-Era Low
Wall Street’s most prominent gauge of investor anxiety, the VIX index of implied stock volatility, closed at a fresh pandemic-era low of 16.25 this week. According to Bank of America Global Fund Manager Survey, 66% of investors think that the U.S equity market is in a late-stage bull market while only 7% of investors think that it is in a bubble.
With markets continuing to hit record highs this week, some investors are concerned that the recent decline in VIX may not last and periodic bouts of higher volatility could occur in the near term. Investors are likely to be torn between optimism over accelerating growth and worries over higher inflation with retail sales for March surging 9.8%, well above the 6.1% market consensus. Spread of new variants of the virus as well as the increased institutional and retail activity in the options market may drive volatility higher.
However, investors can take advantage of this backdrop as future downside volatility can create better entry points for investors seeking to build longer-term exposure.
Chart Of The Week
Important Information and Disclosure
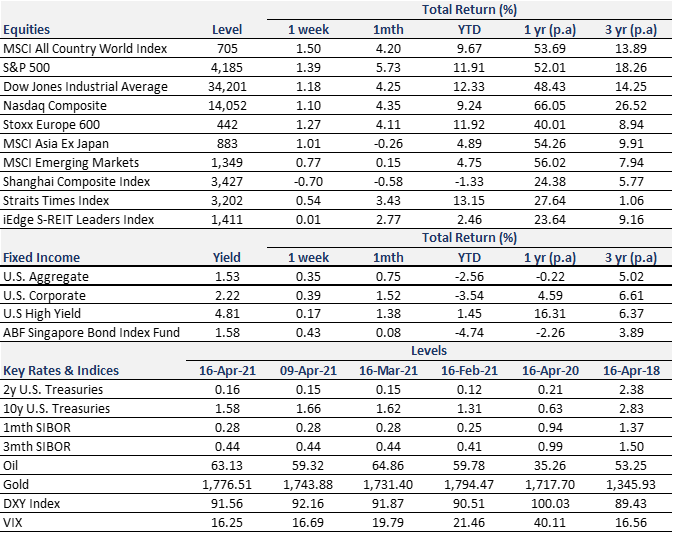
Equity Price Level and Returns: All returns represent the total return for stated period. MSCI ACWI: Global equity index provided by Morgan Stanley Capital International (MSCI). S&P 500: Market capitalization index of U.S stocks provided by Standard & Poor’s (S&P). Dow Jones: Price-weighted index of U.S stocks provided by S&P. NASDAQ: Market capitalization index of U.S stocks provided by NASDAQ. Stoxx 600: Market capitalization index of stocks listed in European region. MSCI Asia Ex Japan: Asia excluding Japan equity index provided by MSCI. MSCI EM: Emerging markets equity index provided by MSCI. SSE: Capitalization weighted index of all A-shares and B-shares listed on Shanghai Stock Exchange. STI: Market capitalization index of stocks listed on Singapore Exchange. SREITLSP: Market capitalization index of the most liquid real estate investment trusts in Singapore.
Fixed Income Yield and Returns: All returns represent total return for stated period. Global Aggregate: Global investment grade debt from both developed and emerging markets issuers. U.S. Aggregate, U.S Corporate, High Yield provided by Bloomberg Barclays Indices, ICE Data Services & WSJ. SBIF: ABF Singapore bond index fund provided by Nikko AM.
Key Interest Rates: 2-Year U.S Treasuries, 10 Year Treasuries, Bloomberg. 1-month, 3-month SIBOR: Singapore Interbank Offered Rates provided by Association of Banks in Singapore (ABS). Oil (WTI): Global oil benchmark, Bloomberg. Gold: Gold Spot USD/Oz, Bloomberg. DXY Index: U.S. Dollar Index, Bloomberg. VIX: Expectation of volatility based on S&P index options provided by Chicago Board Options Exchange (CBOE).
The information provided herein is intended for general circulation and/or discussion purposes only. It does not account for the specific investment objectives, financial situation or needs of any individual. The information in this document is not intended to constitute research analysis or recommendation and should not be treated as such.
This does not constitute an offer or solicitation to buy/sell any financial instrument or to participate any investment strategy. No representation or warranty whatsoever (without limiting to accuracy, usefulness, adequacy, timeliness or completeness) in respect of any information (without limiting to any statement, figures, opinion, view or estimate). Syfe does not undertake an obligation to update the information or to correct any inaccuracy that may become apparent at a later time. All information presented is subject to change without notice. Syfe shall not be responsible or liable for any loss or damage whatsoever arising directly or indirectly as a result of any person acting on any information provided herein.
The information provided herein may contain projections or other forward-looking statement regarding future events or future performance of countries, assets, markets or companies. Actual events or results may differ materially. Past performance figures are not necessarily indicative of future of likely performance. Any reference to any specific company, financial product or asset class in whatever way is used for illustrative purposes only and does not constitute a recommendation. Investors should note that there are necessarily limitations and difficulties in using any graph, chart, formula or other device to determine whether or not, or if so, when to, make an investment. The contents hereof are considered proprietary information and may not be produced or disseminated in whole or in part without Syfe’s written consent.

You must be logged in to post a comment.