
Week In Review
Week Ahead
• US Consumer Confidence (Dec)
• China Manufacturing PMI (Dec)
Thought Of The Week
Trump’s Tantrum
Although it was a short trading week due to the holiday season, US President Donald Trump did not fail to create more chaos in the markets than needed. Congress finally passed a US$900 billion fiscal stimulus package after months of negotiations but was met with strong criticisms by Trump. His attack on the relief bill came after he vetoed the annual US defence spending bill worth US$740 billion. Democrats and Republicans have stated that they have both the intention and necessary votes to override Trump’s objection to the defence bill, which would mark the first time that Congress overrules him over a veto.
The EU-UK Deal is Done
EU and UK have finally sealed a Christmas trade agreement that will define the £660 billion trading relationship after hammering the painful compromises over fishing rights and satisfying EU’s demands for a regulatory level playing field. The compromise would allow UK to maintain the freedom to set its own rules while giving the EU comfort that it could retaliate if things went too far. Although UK will be leaving the customs union and single market, the agreement was generally welcomed by business groups as it allows tariff-free trade on most goods while creating a platform for future co-operation such as crime-fighting, energy and data sharing. The EU and UK will hold a signing ceremony to mark the agreement before 31st December and provisionally apply its terms from 1st January 2021. Sterling traded near its highs of the year against USD as expectations of a deal announcement grew before easing slightly to close at $1.3560.
2020 Year in Review
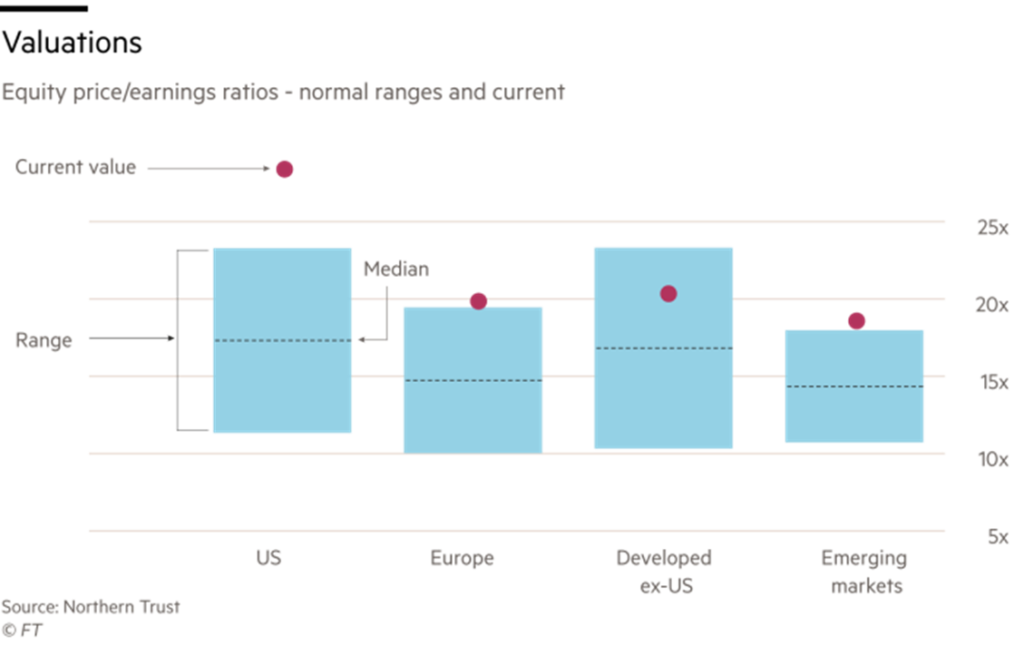
2020 has been a head spinning year for many investors. The global pandemic triggered one of the worst financial crises in history and caused economies to come to a complete halt. Thankfully, governments and central banks acted swiftly and injected unprecedented liquidity into the markets, leading to the strong rebound in both equities and bonds prices. The sharp recovery from the March lows is undoubtedly impressive but given that current valuations are extremely stretched, investors are starting to wonder if this winning streak can extend into 2021. In order to justify current levels that have borrowed heavily from 2021 returns, companies will need to prove a strong rebound in earnings which could be delivered by all the cost cutting measures and buyback programs. At a relatively lower valuation, emerging markets are favoured over US since they are likely to benefit from a stronger economic recovery and a weaker US dollar. Technology, which has been on a tear this year despite more scrutiny by the regulators, is also looking continue to its ‘techopoly’ on our economy in the months and years to come as the future will be far more digital than the past.
Chart Of The Week
Important Information and Disclosure
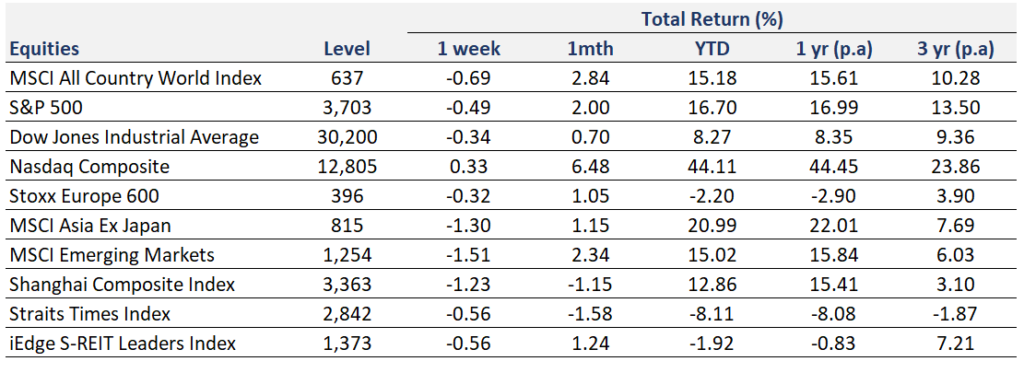
Equity Price Level and Returns: All returns represent the total return for stated period. MSCI ACWI: Global equity index provided by Morgan Stanley Capital International (MSCI). S&P 500: Market capitalization index of U.S stocks provided by Standard & Poor’s (S&P). Dow Jones: Price-weighted index of U.S stocks provided by S&P. NASDAQ: Market capitalization index of U.S stocks provided by NASDAQ. Stoxx 600: Market capitalization index of stocks listed in European region. MSCI Asia Ex Japan: Asia excluding Japan equity index provided by MSCI. MSCI EM: Emerging markets equity index provided by MSCI. SSE: Capitalization weighted index of all A-shares and B-shares listed on Shanghai Stock Exchange. STI: Market capitalization index of stocks listed on Singapore Exchange. SREITLSP: Market capitalization index of the most liquid real estate investment trusts in Singapore.
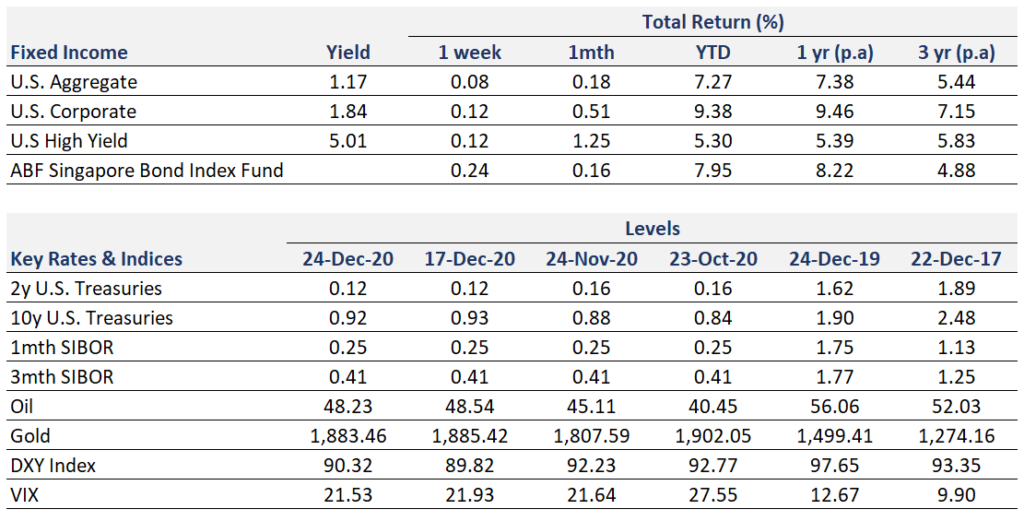
Fixed Income Yield and Returns: All returns represent total return for stated period. Global Aggregate: Global investment grade debt from both developed and emerging markets issuers. U.S. Aggregate, U.S Corporate, High Yield provided by Bloomberg Barclays Indices, ICE Data Services & WSJ. SBIF: ABF Singapore bond index fund provided by Nikko AM.
Key Interest Rates: 2-Year U.S Treasuries, 10 Year Treasuries, Bloomberg. 1-month, 3-month SIBOR: Singapore Interbank Offered Rates provided by Association of Banks in Singapore (ABS). Oil (WTI): Global oil benchmark, Bloomberg. Gold: Gold Spot USD/Oz, Bloomberg. DXY Index: U.S. Dollar Index, Bloomberg. VIX: Expectation of volatility based on S&P index options provided by Chicago Board Options Exchange (CBOE).
The information provided herein is intended for general circulation and/or discussion purposes only. It does not account for the specific investment objectives, financial situation or needs of any individual. The information in this document is not intended to constitute research analysis or recommendation and should not be treated as such.
This does not constitute an offer or solicitation to buy/sell any financial instrument or to participate any investment strategy. No representation or warranty whatsoever (without limiting to accuracy, usefulness, adequacy, timeliness or completeness) in respect of any information (without limiting to any statement, figures, opinion, view or estimate). Syfe does not undertake an obligation to update the information or to correct any inaccuracy that may become apparent at a later time. All information presented is subject to change without notice. Syfe shall not be responsible or liable for any loss or damage whatsoever arising directly or indirectly as a result of any person acting on any information provided herein.
The information provided herein may contain projections or other forward-looking statement regarding future events or future performance of countries, assets, markets or companies. Actual events or results may differ materially. Past performance figures are not necessarily indicative of future of likely performance. Any reference to any specific company, financial product or asset class in whatever way is used for illustrative purposes only and does not constitute a recommendation. Investors should note that there are necessarily limitations and difficulties in using any graph, chart, formula or other device to determine whether or not, or if so, when to, make an investment. The contents hereof are considered proprietary information and may not be produced or disseminated in whole or in part without Syfe’s written consent.

You must be logged in to post a comment.