
The Week Ahead
- China Manufacturing PMI (Feb)
- RBA Rate Statement
- U.S Nonfarm Payrolls & Unemployment Rate (Feb)
Thought Of The Week
Inflation Jitters, Fed Chair Jerome Powell Testifies
The 10-year U.S Treasury yield touched 1.6085% on Thursday, the highest since last February on an increased conviction that the economy will recover rapidly. The recent surge in commodity prices due to the cold weather in the U.S and the potential pullback in monetary policy support added to the fears of an accelerating inflation. Tech-heavy index Nasdaq, which had benefitted largely from the low discount rate environment sold off heavily before Federal Reserve Chair Jerome Powell pushed back on inflation concerns during his second day of Congressional testimony.
He reassured markets that rates are likely to stay low as the recent signs of rising prices will not lead to persistently high inflation and the labour market is still far from its employment target. His comments provided some comfort since the low-rate environment that the markets have been very reliant on will not be disrupted so soon, which helped to stop the bleeding in the final trading hour. On the other hand, energy and financials were among the top performers amid improving economic outlook and rising rates supporting banks’ profitability. All three U.S indices were down for the week.
Vaccines and Virus
Asian nations are finally starting to kick off inoculations after sitting on the sidelines as the western counterparts raced to snatch up supply. Hong Kong began its program on Monday, with Beijing-based Sinovac’s product. Japan, Australia and New Zealand are also vaccinating priority groups with shots from Pfizer-BioNTech and AstraZeneca while other countries such as Malaysia, South Korea and Thailand followed suit this week.
Johnson & Johnson also reported positive vaccine data with its efficacy consistent with trial results, the third Covid-19 vaccine to receive approval by the U.S Food and Drug Administration (FDA). Meanwhile, Moderna is also exploring how booster shots can beat virus variants while a study in Israel of 1.2 million proved the effectiveness of Pfizer-BioNTech vaccine, providing a glimmer of hope that immunizations could help end the pandemic soon.
Commodities Rally Boosting AUDSGD
AUDSGD climbed to a three-year high at 1.0545 on Wednesday, largely backed by the outperformance in raw materials. Copper broke through $9,500 for the first time since 2011 while iron ore and nickel doubled since March low on the back of higher demand for green economy materials. With investors betting on a strong demand growth as economies reopen, the strength in the Australian dollar has been picking up in recent weeks as it is considered as a cyclical currency due to its high exposure to commodity exports. Companies that may benefit from the strengthening Australian dollar include Ascendas REIT, Keppel REIT and Ascott REIT due to their presence in Australia.
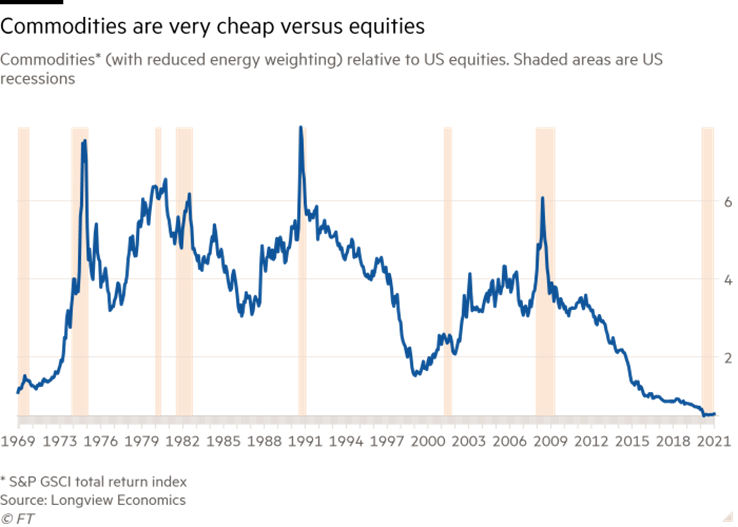
Chart Of The Week
Important Information and Disclosure
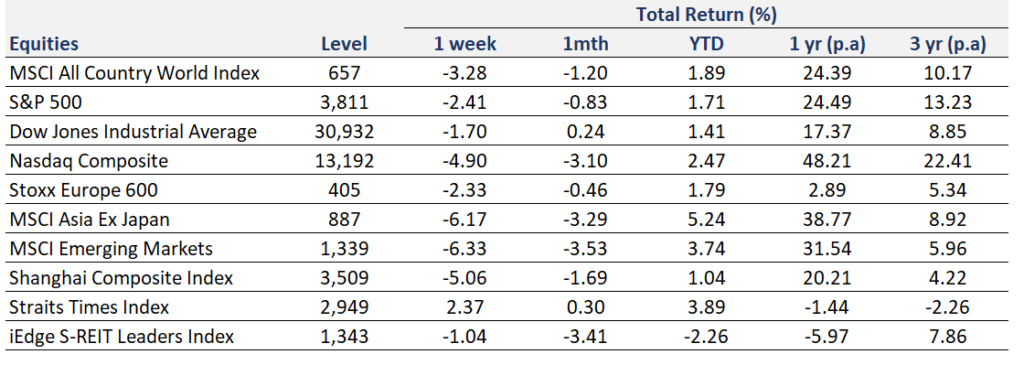
Equity Price Level and Returns: All returns represent the total return for stated period. MSCI ACWI: Global equity index provided by Morgan Stanley Capital International (MSCI). S&P 500: Market capitalization index of U.S stocks provided by Standard & Poor’s (S&P). Dow Jones: Price-weighted index of U.S stocks provided by S&P. NASDAQ: Market capitalization index of U.S stocks provided by NASDAQ. Stoxx 600: Market capitalization index of stocks listed in European region. MSCI Asia Ex Japan: Asia excluding Japan equity index provided by MSCI. MSCI EM: Emerging markets equity index provided by MSCI. SSE: Capitalization weighted index of all A-shares and B-shares listed on Shanghai Stock Exchange. STI: Market capitalization index of stocks listed on Singapore Exchange. SREITLSP: Market capitalization index of the most liquid real estate investment trusts in Singapore.
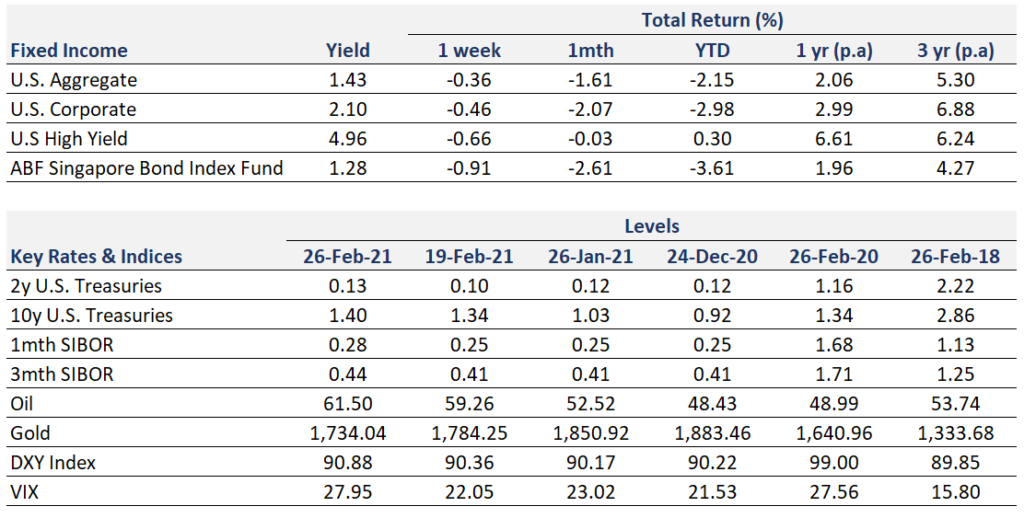
Fixed Income Yield and Returns: All returns represent total return for stated period. Global Aggregate: Global investment grade debt from both developed and emerging markets issuers. U.S. Aggregate, U.S Corporate, High Yield provided by Bloomberg Barclays Indices, ICE Data Services & WSJ. SBIF: ABF Singapore bond index fund provided by Nikko AM.
Key Interest Rates: 2-Year U.S Treasuries, 10 Year Treasuries, Bloomberg. 1-month, 3-month SIBOR: Singapore Interbank Offered Rates provided by Association of Banks in Singapore (ABS). Oil (WTI): Global oil benchmark, Bloomberg. Gold: Gold Spot USD/Oz, Bloomberg. DXY Index: U.S. Dollar Index, Bloomberg. VIX: Expectation of volatility based on S&P index options provided by Chicago Board Options Exchange (CBOE).
The information provided herein is intended for general circulation and/or discussion purposes only. It does not account for the specific investment objectives, financial situation or needs of any individual. The information in this document is not intended to constitute research analysis or recommendation and should not be treated as such.
This does not constitute an offer or solicitation to buy/sell any financial instrument or to participate any investment strategy. No representation or warranty whatsoever (without limiting to accuracy, usefulness, adequacy, timeliness or completeness) in respect of any information (without limiting to any statement, figures, opinion, view or estimate). Syfe does not undertake an obligation to update the information or to correct any inaccuracy that may become apparent at a later time. All information presented is subject to change without notice. Syfe shall not be responsible or liable for any loss or damage whatsoever arising directly or indirectly as a result of any person acting on any information provided herein.
The information provided herein may contain projections or other forward-looking statement regarding future events or future performance of countries, assets, markets or companies. Actual events or results may differ materially. Past performance figures are not necessarily indicative of future of likely performance. Any reference to any specific company, financial product or asset class in whatever way is used for illustrative purposes only and does not constitute a recommendation. Investors should note that there are necessarily limitations and difficulties in using any graph, chart, formula or other device to determine whether or not, or if so, when to, make an investment. The contents hereof are considered proprietary information and may not be produced or disseminated in whole or in part without Syfe’s written consent.

You must be logged in to post a comment.