

Markets enter 2026 in a period of transition rather than disruption. Inflation pressures are easing, growth is slowing but holding up, and monetary policy is moving away from peak restriction. At the same time, elevated valuations, market concentration, and rising capital intensity mean that returns are likely to be more selective and harder earned than in the immediate post-pandemic rebound.
This outlook sets out how we see the year ahead, shaped by evolving macro conditions, market structure, and the forces likely to drive portfolio outcomes in 2026.
1. 2025 Market Review: Broad Returns and a Higher Bar for US Assets
Risk-on sentiment defined markets in 2025, culminating in an “everything rally” that saw all major asset classes deliver positive returns for the first time since the pandemic. Despite significant crosscurrents, most notably heightened trade tensions in the first half as US tariffs reached levels last seen in the 1930s, markets ended the year on new highs. Developed market equities fell sharply in early April but rebounded strongly, ending the year up +21.6% as fiscal and monetary stimulus took centre stage in the second half.
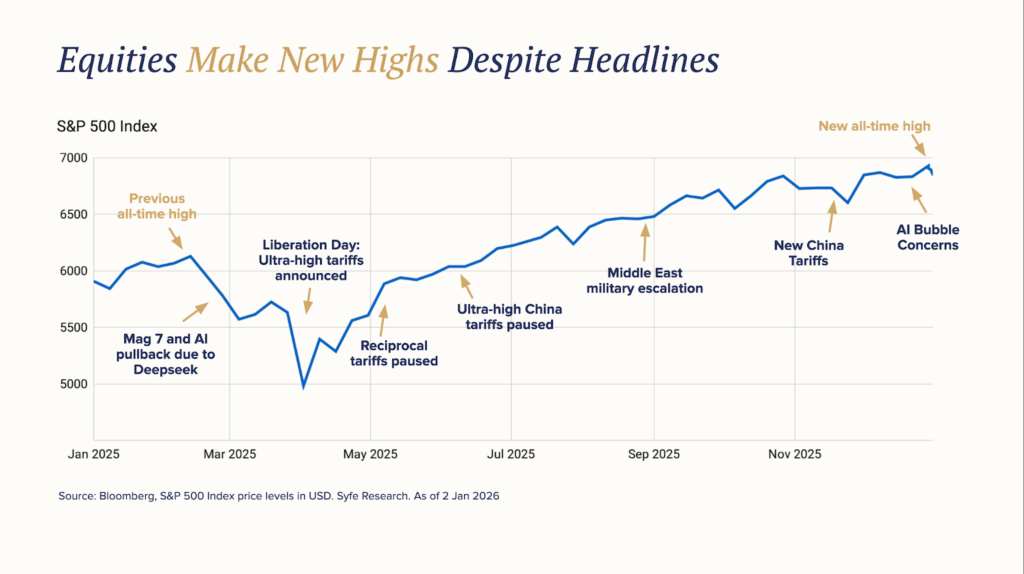
Equity performance broadened decisively beyond the United States. Emerging markets led global equities with returns of +34.4% in USD, supported by strong gains across Asia and Latin America. Growth stocks outperformed in the US, driven by continued enthusiasm around AI, while value stocks led in most other developed markets. US equities gained +17.9% but lagged behind other regions, marking the first time in two decades that the S&P 500 was the weakest-performing major market.
Currency amplified this shift. The US dollar weakened by 9% in 2025, boosting USD-based returns for international assets while raising the hurdle for US assets to outperform in real terms.
Precious metals stood out as the top-performing asset class. Strong central bank demand and ETF inflows propelled Gold higher, gaining over 60%, while Silver surged even more sharply and lifted overall commodities despite weaker oil prices. Fixed income also benefited from easing inflation fears, rate cuts by major central banks, and a weaker US dollar, helping global bonds return +8.2%.
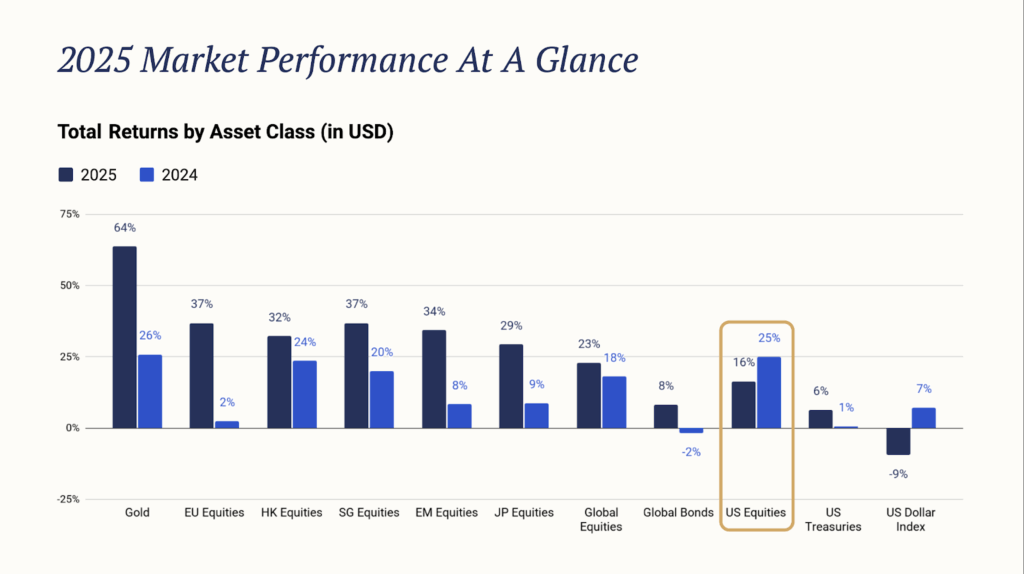
Overall, 2025 underscored the value of diversification. After years of US and mega-cap dominance, returns broadened across regions and asset classes, setting the stage for a more balanced global investment landscape heading into 2026.
This environment reinforced the importance of diversified portfolio construction. Within Syfe’s Core portfolios, including Core Equity100, this shift informed a recent rebalancing that reduced reliance on a narrow group of US mega-cap growth stocks and increased exposure to international markets and more profitable companies—positioning portfolios for a regime where breadth and diversification matter more than index momentum.
Portfolio implications:
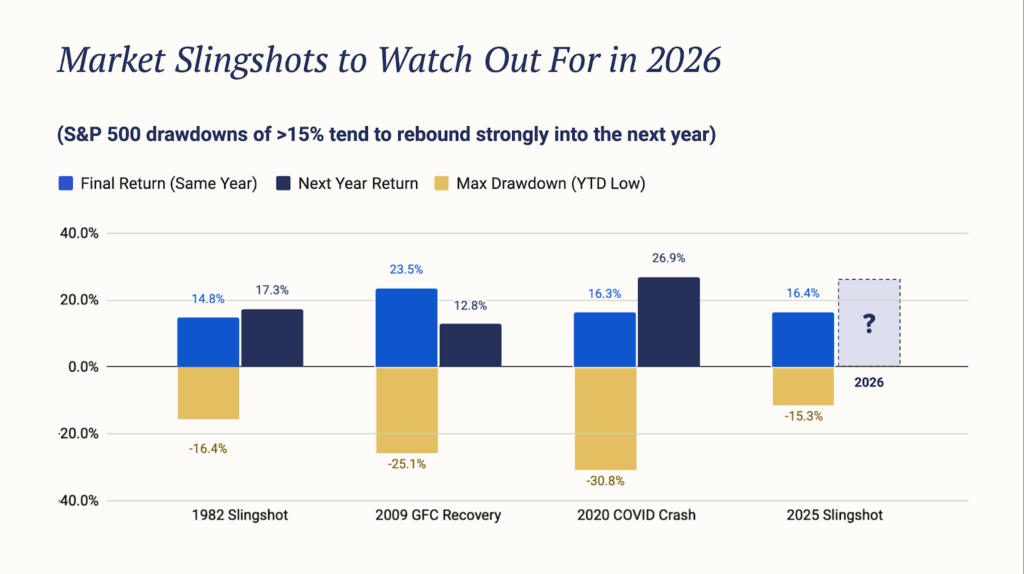
When leadership broadens and currencies matter again, diversification becomes a return driver rather than a defensive choice. Concentration risk was exposed in 2025, while globally diversified portfolios proved more resilient. Remaining invested while managing headline risks will remain important, as the market rebound may continue into 2026.
2. Economic Outlook: Continued Expansion as Inflation Eases
Growth: moderation, not contraction
We expect global growth to continue through 2026, albeit at a more moderate pace. The Federal Reserve’s December Summary of Economic Projections places US real GDP growth around 2.5%-3.0% in 2026, with unemployment stabilising near 4.4%—levels consistent with expansion rather than recession.
Growth is increasingly supported by private investment and productivity improvements rather than fiscal stimulus. For markets, this matters because earnings growth does not require acceleration; it requires durability.
Inflation: disinflation is structural
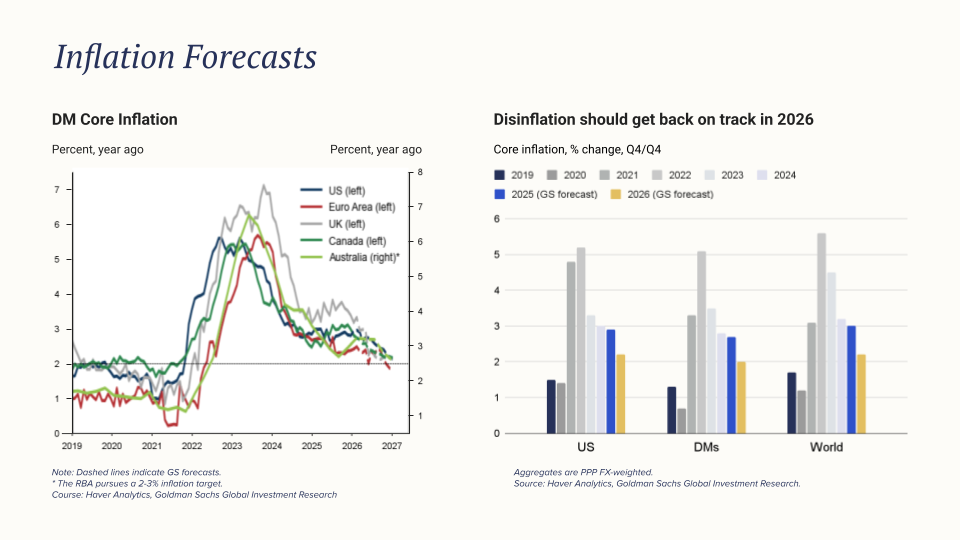
Our inflation outlook remains more constructive than prevailing scepticism. Disinflation is being driven by several forces acting together:
- Wage growth has cooled materially from post-pandemic peaks
- Shelter inflation is rolling over, with its typical lag
- Productivity is improving, supported by automation and digital investment
- Trade-related price shocks have so far behaved as one-off adjustments rather than persistent inflation loops
The Fed’s own projections reflect this progress, with PCE inflation expected around 2.4–2.5% in 2026, down from 2025 levels.
Portfolio implications:
Disinflation driven by productivity and supply-side improvements is supportive for earnings and risk assets, reducing the likelihood that inflation alone forces a return to restrictive policy.
3. The Federal Reserve Path: Moving Toward Neutral
The central policy question for 2026 is not whether rates fall sharply, but where they settle.
The Fed’s median projection places the policy rate around 3.4% by end-2026. We expect policy to reach around 3.1% by the end of 2026, reflecting continued disinflation and easing labour-market tightness.
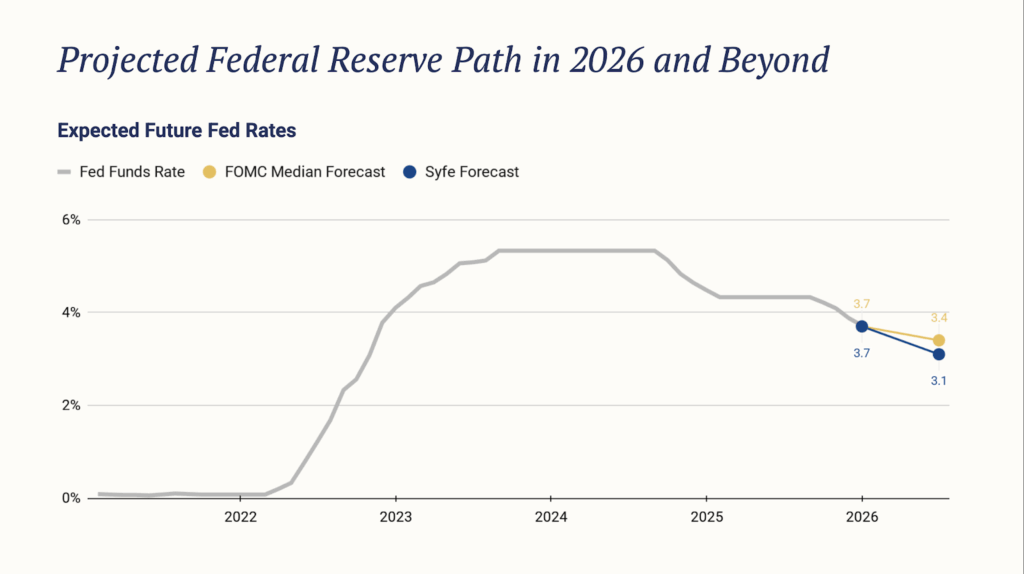
Recent remarks from senior policymakers reinforce this trajectory. Official forecasts assume inflation continues to cool without a material rise in unemployment, reducing the need to keep policy at peak restrictive levels.
For markets, the implication is a regime shift rather than aggressive easing:
- real rates drift lower,
- financial conditions ease at the margin,
- and the opportunity cost of holding cash rises.
Portfolio implications:
A gradual move toward neutral supports diversification, duration, and income assets, even without a return to ultra-loose monetary conditions.
4. Top Investment Themes for 2026
In 2026, the bull market may continue, led by AI and supported by steady growth, lower inflation, and accommodative policy. With earnings accelerating globally and China’s AI story gaining international traction, returns are broadening across regions. In a post–peak-rate world, fixed income is emerging as a meaningful driver of total returns rather than just a defensive hedge.
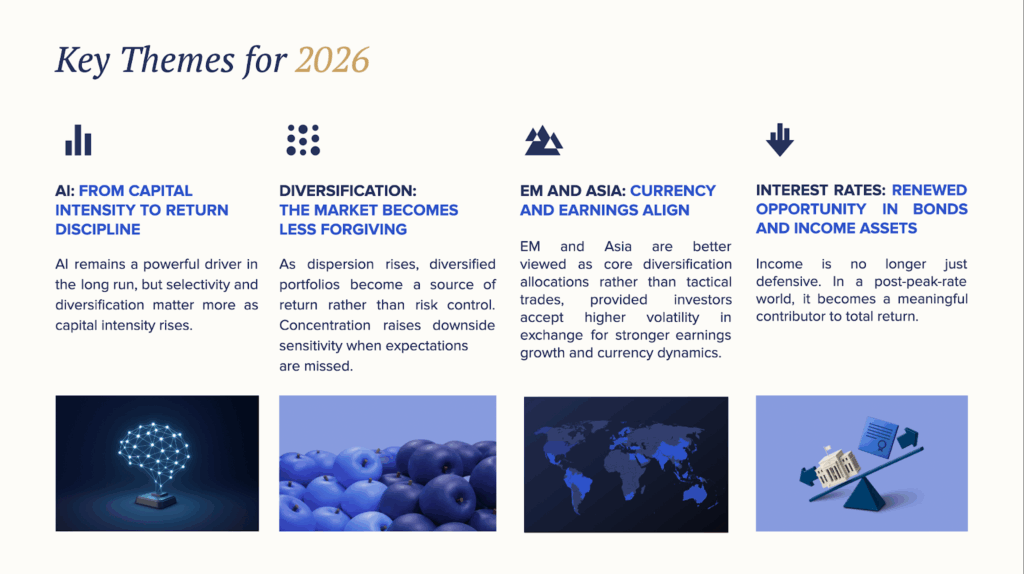
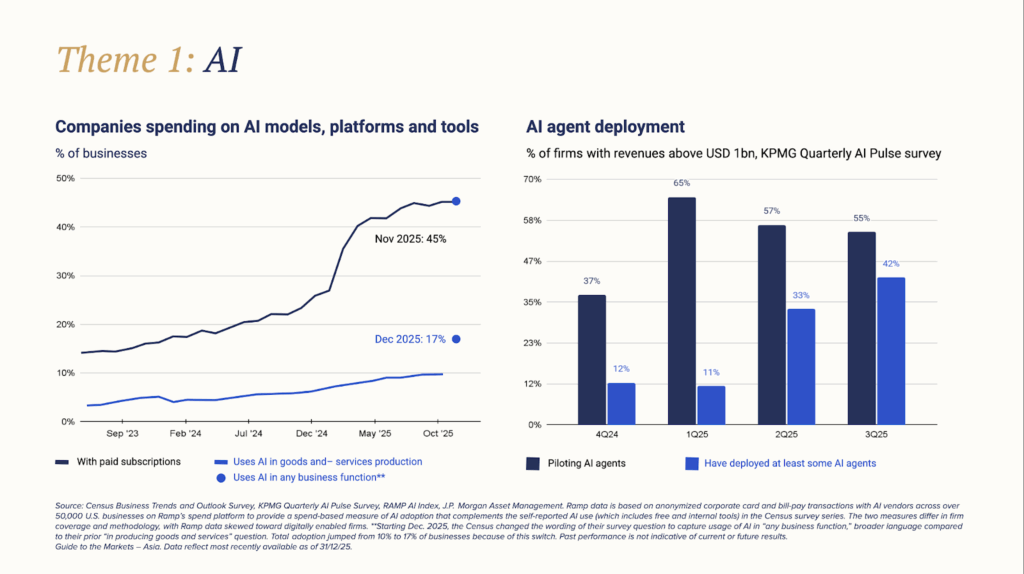
Theme 1: AI – From Capital Intensity to Return Discipline
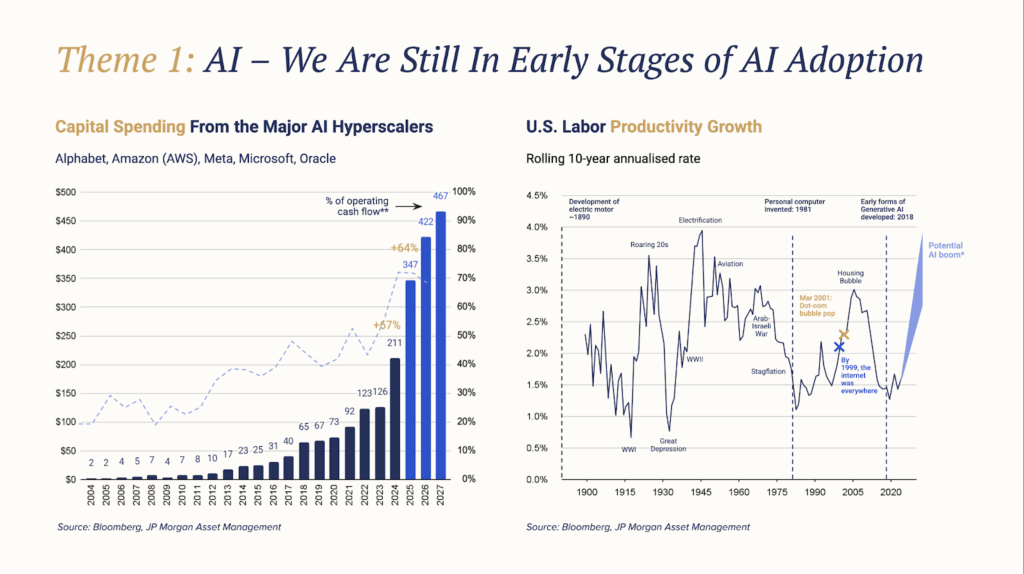
AI has entered a full-scale infrastructure build-out phase. We expect annual AI-related infrastructure spending to exceed USD 400–500 billion by 2026, driven by accelerated data-centre construction, higher-density compute requirements, and rising power and cooling needs. At this level, AI infrastructure investment approaches ~2% of US GDP, placing it alongside past general-purpose technology cycles such as cloud computing and telecommunications.
Adoption is now measurable. Around 9–10% of US firms have embedded AI into production processes, while 40–45% are paying for AI models or platforms. Early adopters report 5–15% productivity gains in functions such as software development, customer service, and logistics.
However, this remains a front-loaded capital cycle. Cash outflows precede revenue, and monetisation remains uneven across sectors. For current equity valuations to be sustained, the AI ecosystem must ultimately generate USD 1.7–2.5 trillion in incremental annual revenue by the end of the decade.
As infrastructure spending accelerates into 2026, balance-sheet discipline becomes increasingly important. Large cloud and infrastructure providers operate with average debt-to-equity ratios around 0.5x, higher than pre-AI levels. A further ramp-up in capex raises sensitivity to funding costs, utilisation rates, and monetisation timelines. The risk is no longer whether AI adoption happens, but whether capital intensity runs ahead of returns at the margin.
While monetization remains uncertain, consensus is building that AI represents the next general-purpose technology capable of lifting productivity by 1–3% per annum. With adoption still at an early stage, this supports sustained optimism around the theme.
This shift from narrative to execution is reflected in the positioning of Syfe’s Disruptive Technology portfolios, which retain exposure to AI’s structural upside while emphasising monetisation visibility, profitability, and diversification across the value chain rather than concentration in the most crowded segments.
Portfolio implications:
AI remains a powerful long-term driver, but returns in 2026 are increasingly shaped by ROI discipline, balance-sheet strength, and execution. Selectivity and diversification matter more as capital intensity rises.
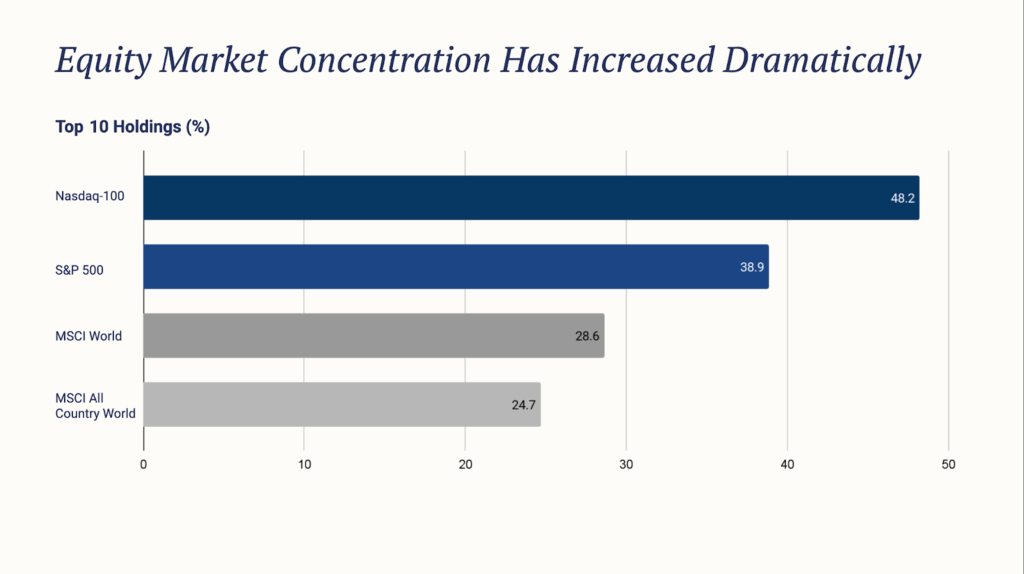
Theme 2: Diversification and Dispersion – The Market Becomes Less Forgiving
Market structure has shifted materially.
The top 10 US stocks account for roughly 40% of S&P 500 market capitalisation, a level historically associated with higher return dispersion and lower tolerance for valuation mistakes.
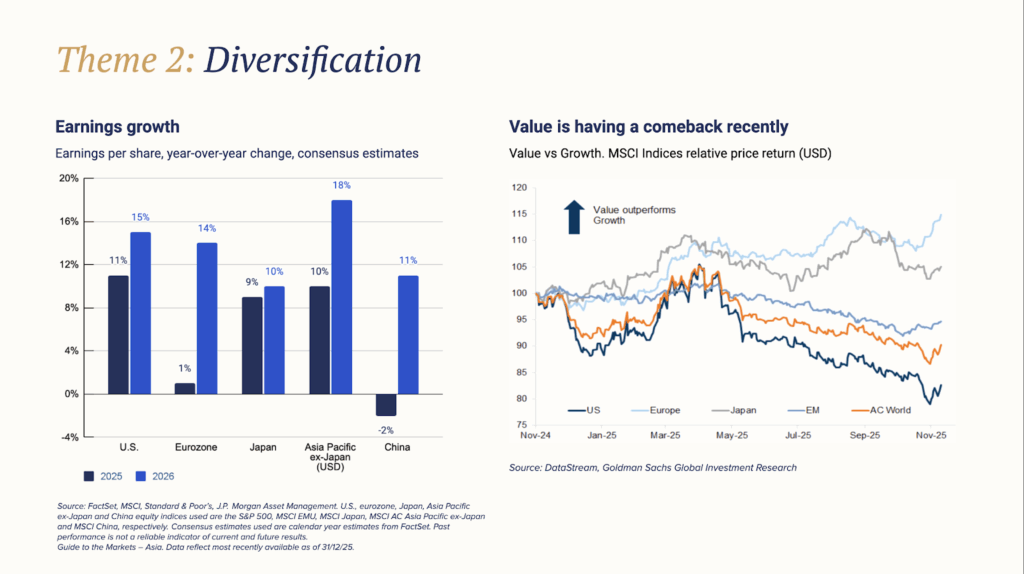
At the same time, valuation dispersion across regions and factors remains wide:
- US large-cap growth trades at a premium to long-term averages
- Europe and Japan trade at discounts despite improving earnings momentum
- Emerging Markets remain cheaper than developed markets on both P/E and P/B measures
Crucially, earnings breadth has improved. In 2025, earnings upgrades extended beyond a narrow group of US mega-caps into Europe, Japan, and parts of EM, driven by better cost discipline, margin resilience, and more shareholder-friendly capital allocation. Factor strength is starting to emerge as ‘growth’ stocks face valuation test and ‘value’ stocks show signs of revival.
This combination of elevated concentration, improving earnings breadth, and wide valuation dispersion marks a transition from a beta-driven phase to an allocation- and selection-driven phase.
This regime shift is directly reflected in the construction of Syfe’s Core portfolios, particularly Core Equity100, which was rebalanced to reduce reliance on narrow leadership and increase exposure to profitable companies across regions.
Portfolio implications:
As dispersion rises, diversified portfolios become a source of return rather than risk control. Concentration increases downside sensitivity when expectations are missed.
Theme 3: Emerging Markets and Asia – Currency and Earnings Align
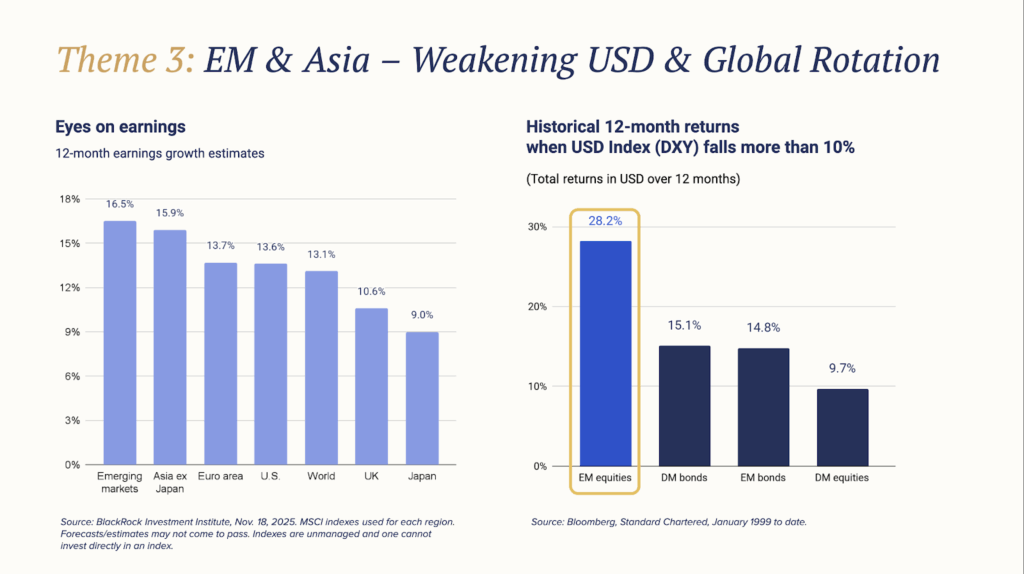
Emerging Markets and Asia stand out as beneficiaries of a weaker USD and improving earnings dynamics.
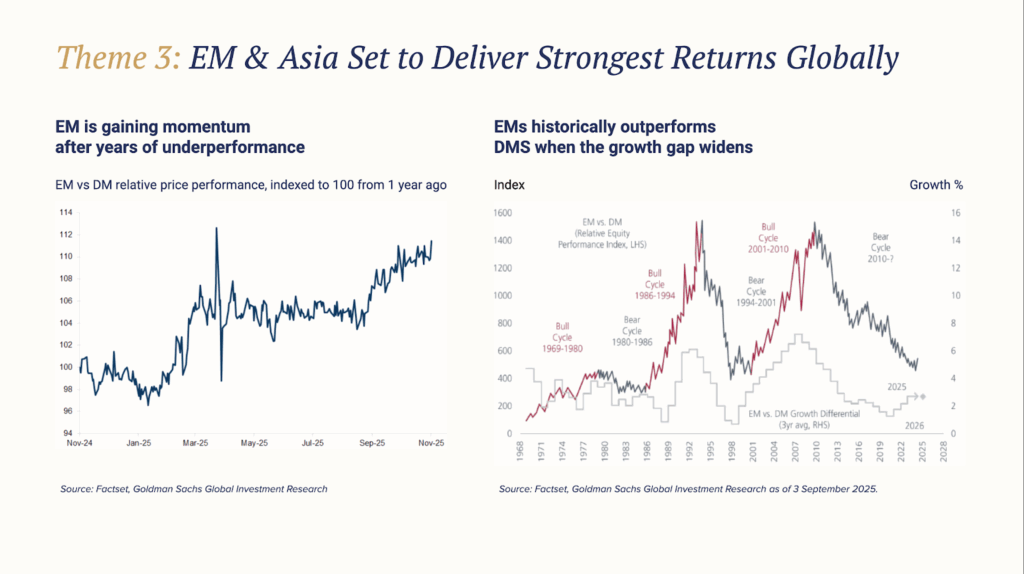
Historically, periods of meaningful USD weakness have coincided with EM equity outperformance of 10–20 percentage points over developed markets. The USD’s ~9.5% decline in 2025 already improved return translation for non-US assets.
Consensus expectations point to mid-to-high single-digit earnings growth across EM and Asia, outpacing developed markets.
Regional nuance matters:
- India remains a structural growth story, but FX and valuation require disciplined sizing
- China is selective rather than broad-based, propelled further with an expanding AI footprint and supported by policy beneficiaries and balance-sheet strength
- ASEAN, including Singapore, benefits from steady global growth and the global tech cycle
Within Syfe portfolios, this view is expressed through Core allocations that treat EM and Asia as structural diversification components, complemented by our thematic China Growth portfolio for more targeted regional exposure.
Portfolio implications:
EM and Asia are better viewed as core diversification allocations rather than tactical trades, provided investors accept higher volatility in exchange for stronger earnings growth and currency dynamics.
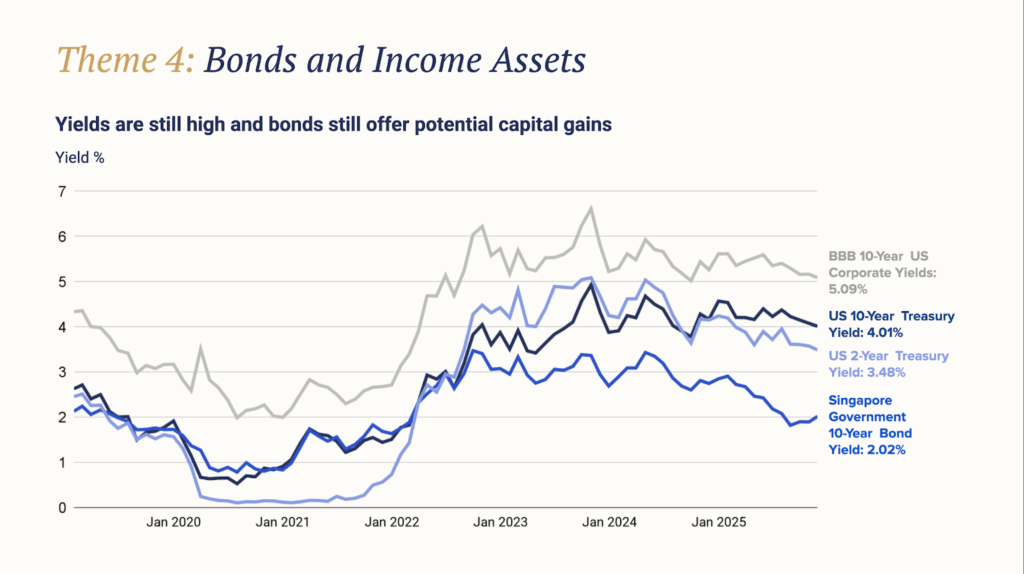
Theme 4: Bonds and Income Assets Re-Enter the Opportunity Set
Bond markets now offer a markedly improved setup:
- 10-year US Treasury yields ~4.2%
- 2-year yields ~3.5%
- BBB US corporate yields ~5.0%
With policy rates expected to drift toward neutral, bonds offer both carry and potential capital gains. Income assets also benefit as rate volatility declines.
This environment aligns closely with the construction of Syfe’s Income+ and REIT+ portfolios, which are designed to capture diversified income streams while managing duration and credit risk.
Portfolio implications:
Income is no longer just defensive. In a post-peak-rate world, it becomes a meaningful contributor to total return.
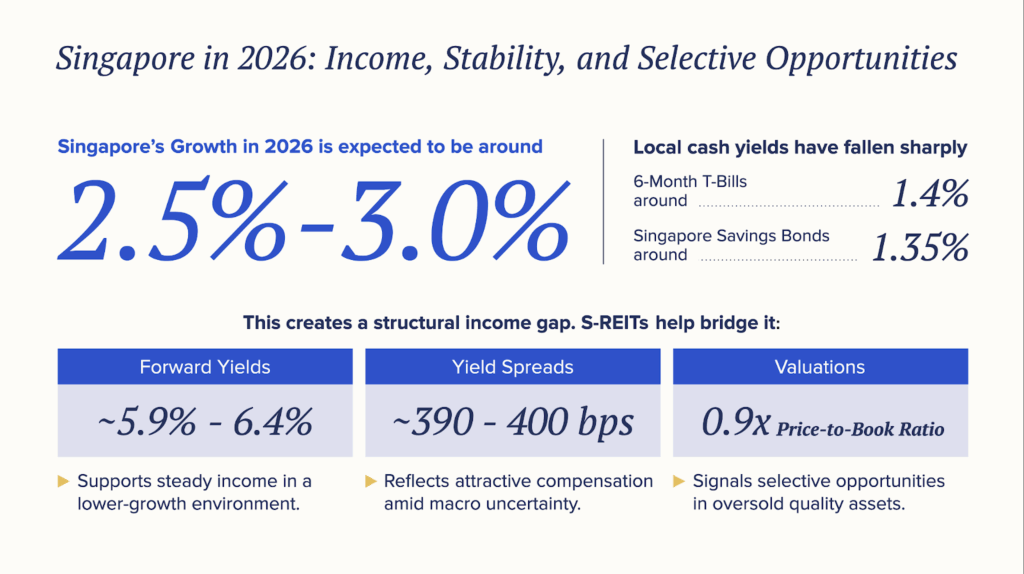
5. Singapore in 2026: Income, Stability, and Selective Opportunities
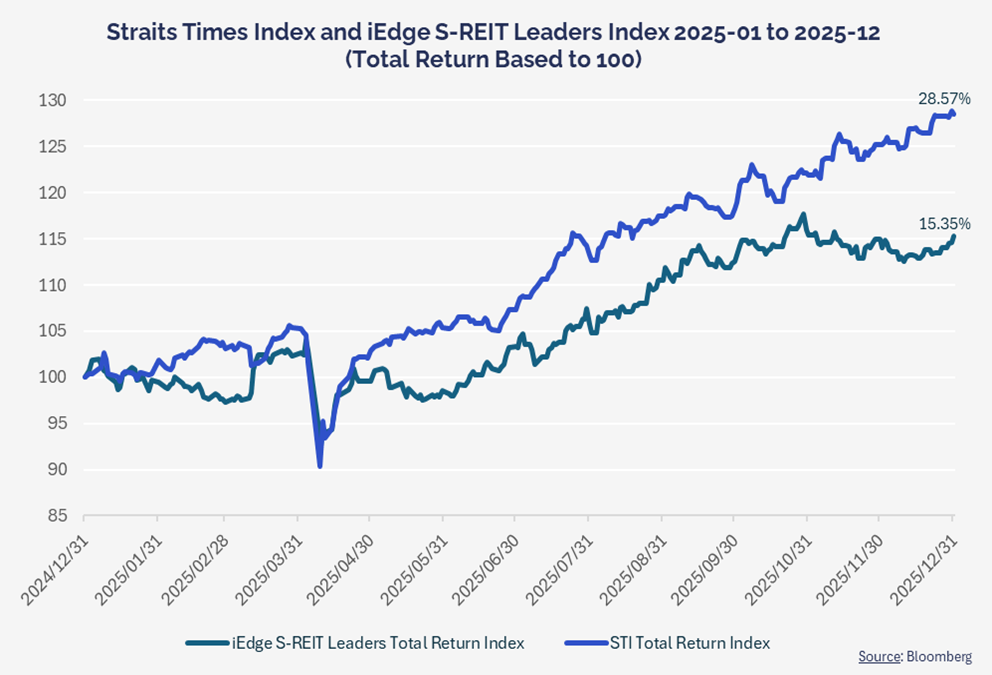
Singapore’s growth is expected to normalise to around 2.5%-3.0% in 2026 after a strong 2025. The STI delivered ~28% total return in 2025, demonstrating that Singapore equities can participate meaningfully when leadership broadens.
Dispersion remains high. Data centres, logistics, and healthcare offer more resilient cash flows, while balance-sheet strength and refinancing risk remain key differentiators.
Market structure: from intent to execution
Beyond income, Singapore has made a deliberate push to strengthen its equity markets.
- NASDAQ–SGX dual listings broaden access for growth and technology companies. With more than 60 Southeast Asian unicorns operating regionally, this may close the exposure gap between where Asia’s wealth is actually being created (in high-growth tech and innovation) and what is listed locally.
- The Equity Development Programme (EQDP) aims to improve research coverage and trading liquidity for selected Singapore-listed firms. Early progress is visible, with average daily trading value reaching S$1.53bn in Q3, the highest since 2021. Even incremental improvements here could materially lift liquidity, particularly for mid-caps that make up the majority of SGX listings
The longer-term objective is not a short-term rally, but a durable expansion of the investable universe, improving valuations, liquidity, and participation over time.
Portfolio context
Singapore exposure works best as part of a broader portfolio:
- Income bucket: Income+ as the foundation, complemented by REIT100 for S-REITs exposure and selective local dividend stocks.
- Growth bucket: Global Core portfolios remain the primary growth engine, with Singapore equities playing a selective, quality-focused role, particularly as market-structure initiatives gain traction.
Portfolio implications:
Singapore in 2026 remains primarily an income market, but ongoing efforts to improve liquidity and attract growth listings add optionality. With low local cash yields, investors are best served by anchoring portfolios in diversified income while maintaining selective exposure to areas where market structure is actively evolving.
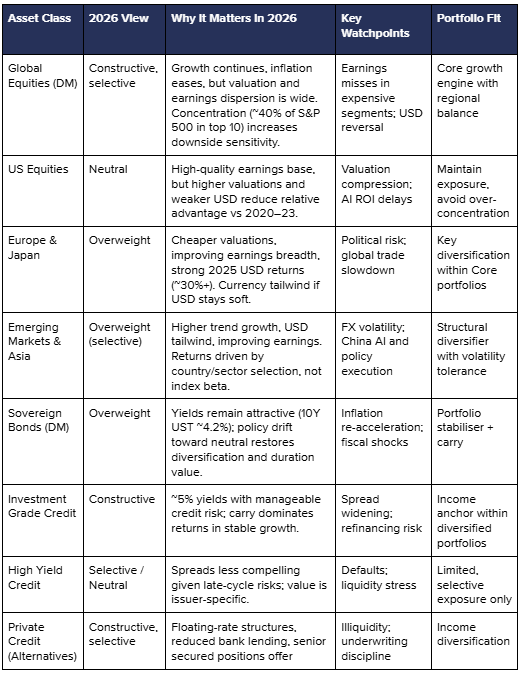
6. Asset Class Convictions for 2026
The 2026 environment rewards assets that deliver income, diversification, and selective growth. With dispersion high and policy normalising, broad beta alone is less reliable; portfolio construction matters more.
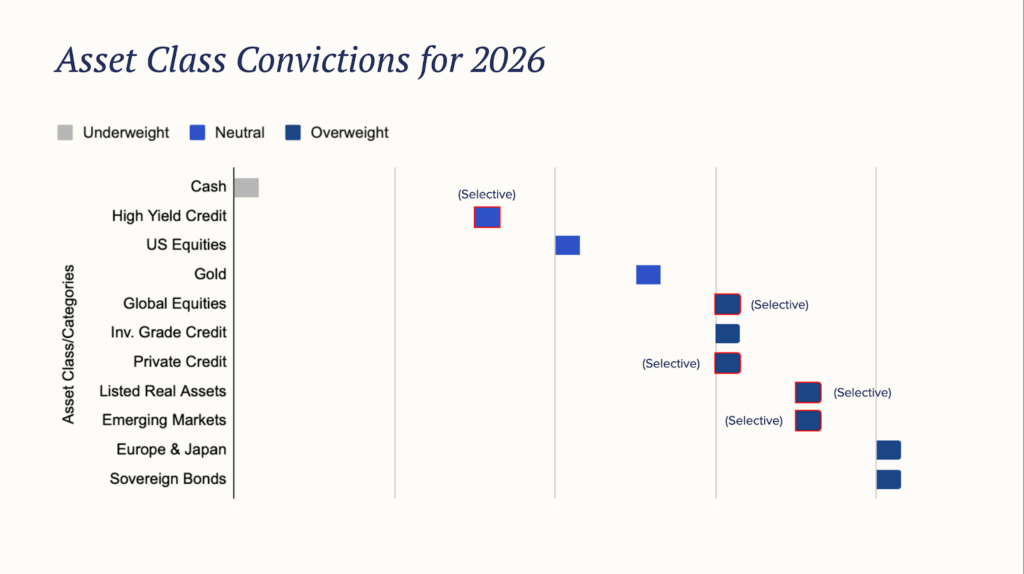
Asset Class Convictions Summary
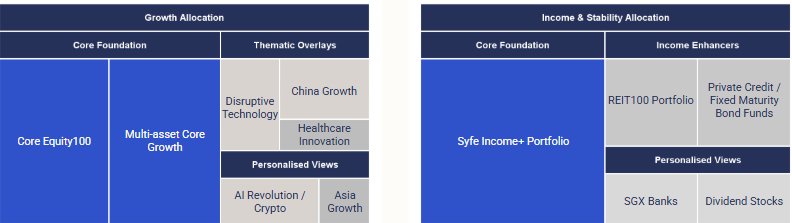
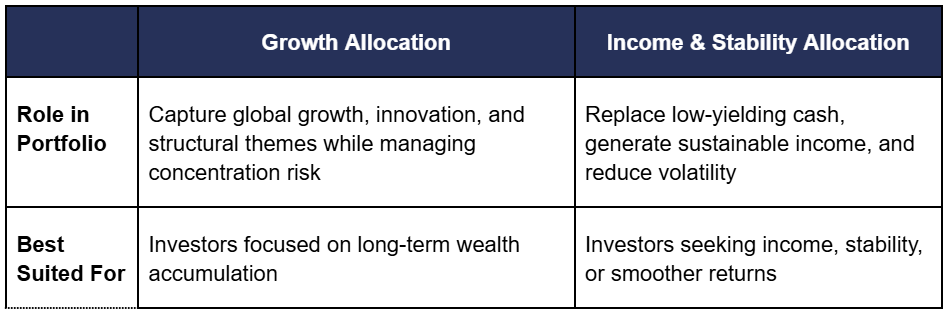
7. How to Build a 2026 Portfolio: Growth vs Income Buckets
A resilient 2026 portfolio is built by combining a diversified growth engine with a robust income foundation and selective alternatives. Syfe portfolios are designed to slot naturally into each bucket, allowing investors to scale growth, income, and personalisation without sacrificing diversification or discipline.
Closing Thought
2026 is a year of transition—from inflation to disinflation, from restriction to neutrality, and from concentration to broader opportunity. The objective is not to predict a single outcome, but to compound across a range of plausible scenarios while managing concentration and valuation risk.
Portfolios positioned for that transition are better placed to deliver resilient outcomes in the year ahead.
Read More:
Syfe H2 2025 Market Outlook: From US Dominance to Global Resurgence
What the Latest Fed Rate Cut Means for Bonds and Investors in 2025
How to Position Your Investment Portfolio When the US Dollar is Weak

You must be logged in to post a comment.