
This article was first published in The Business Times.

The S&P 500 is in a bear market down more than 20% on YTD basis with the NASDAQ growth index down more than 30%. Hordes of first time investors who came into the markets over the last two years are seeing their profits eroded or experiencing deep losses with the growth stocks plummeting. The question that is top of mind for investors today is whether we are headed for another ‘lost decade’ of investing, and how should we prepare ourselves for the times ahead?
A lost decade refers to a long period of over ten years where the stock market produces flat to negative returns. Since the Great Depression, there have been two ‘lost decades’ in the US stock market and speculation is rife about the markets entering into another.
As the chart above shows, the first ‘lost decade’ started around the 1970s and marked a period now known as the Great Inflation. It was a major time of upheaval for the world where geopolitical disruptions such as the Yom Kippur War, Iran Revolution and the Vietnam War, fuelled interruptions in middle eastern energy exports, leading to shortages across the globe. The skyrocketing cost of energy led to inflation rates peaking at 14%, followed soon by an economic recession. During this period, the S&P 500 lost close to 50% of its value across a 20-month period, and generated a mere 0.1% annualised returns over more than a decade.
The second ‘lost decade’ started around the 2000s, ending in the Great Recession. The hype over technology start-ups led to overvaluations and the burst of the dot-com bubble, wiping out $5 trillion U.S. in technology-firm market value between March and October of 2002. Amazon, one of the few companies which survived the crisis had its stock plunge 90% across 2000 – 2002. Then came the dawn of the sub-prime crisis in 2008 when the U.S. entered a deep recession with nearly 9 million jobs lost within a year. In this period, the S&P fell 49.17% from its new high in October 2007 before bottoming out in March 2009.
How is the current situation different from the ‘lost decades’ of the past and what lessons can we glean from history to chart the way forward?
Is it different this time?
There is a lot of comparison of the current market situation to what happened in the 1970s, and the similarities are hard to ignore. Since 2020, the Fed has pursued easy monetary policies in response to the Covid crisis bringing interest rates to zero and doubling its balance sheet to $8.9 trillion. Coming into this year, we are seeing decades-high inflation exacerbated with the Russia-Ukraine war, rising commodity prices, China’s uncertain Covid policies and supply chain disruptions across the globe.
Yet the current situation is different in three ways namely the Fed’s stance on fighting inflation, energy dependency and global trade dynamics. Learning from lessons of the past, the Fed has signaled its intention to continue its aggressive rate hiking policy to tame inflation and prevent a run of inflation rates into double digits as it happened in the 1970s even if it leads to short term pains. Leading indicators such as the labour market, on the other hand, continue to remain strong with unemployment rates below 4%. The US Consumer confidence index also jumped to 108 in September from 103.4 in August, defying recession fears. We are hopeful that the Fed will be able to achieve a soft landing through its policies, with milder recession, if any, and keep long term growth prospects on track.
While energy prices have risen sharply as a result of the war, it is important to highlight that the world is less dependent on oil today. Oil prices have been stable for decades and the drive for green energy and ESG policies have also ensured that we are less susceptible to energy shortage shocks.
China, being the world’s second largest economy by nominal GDP will certainly have an impact on global trade as it gears for reopening towards the end of 2022. While we cannot be certain about the COVID-zero policy calibrations and timings of China, we know that the reopening, when it happens, will certainly have an incremental impact on overall global recovery.
In short, while the probability of a recession, hopefully mild, has increased, the broader economy is still in flux and we are in better control than before.
Patience remains the best bet
Investors who started investing at the start of the ‘lost decades’ were in for a rude shock as their stock portfolio value did not change for more than a decade. Understandably, people are wary of deploying funds in the current environment.
While we certainly don’t have a crystal ball into the future, history tells us that building wealth successfully is not about being able to predict the dawn of a ‘lost decade’ or time the lows, but the ability to be patient. Stock markets have been very generous to investors who can get through such periods of decline and invest for the long run.
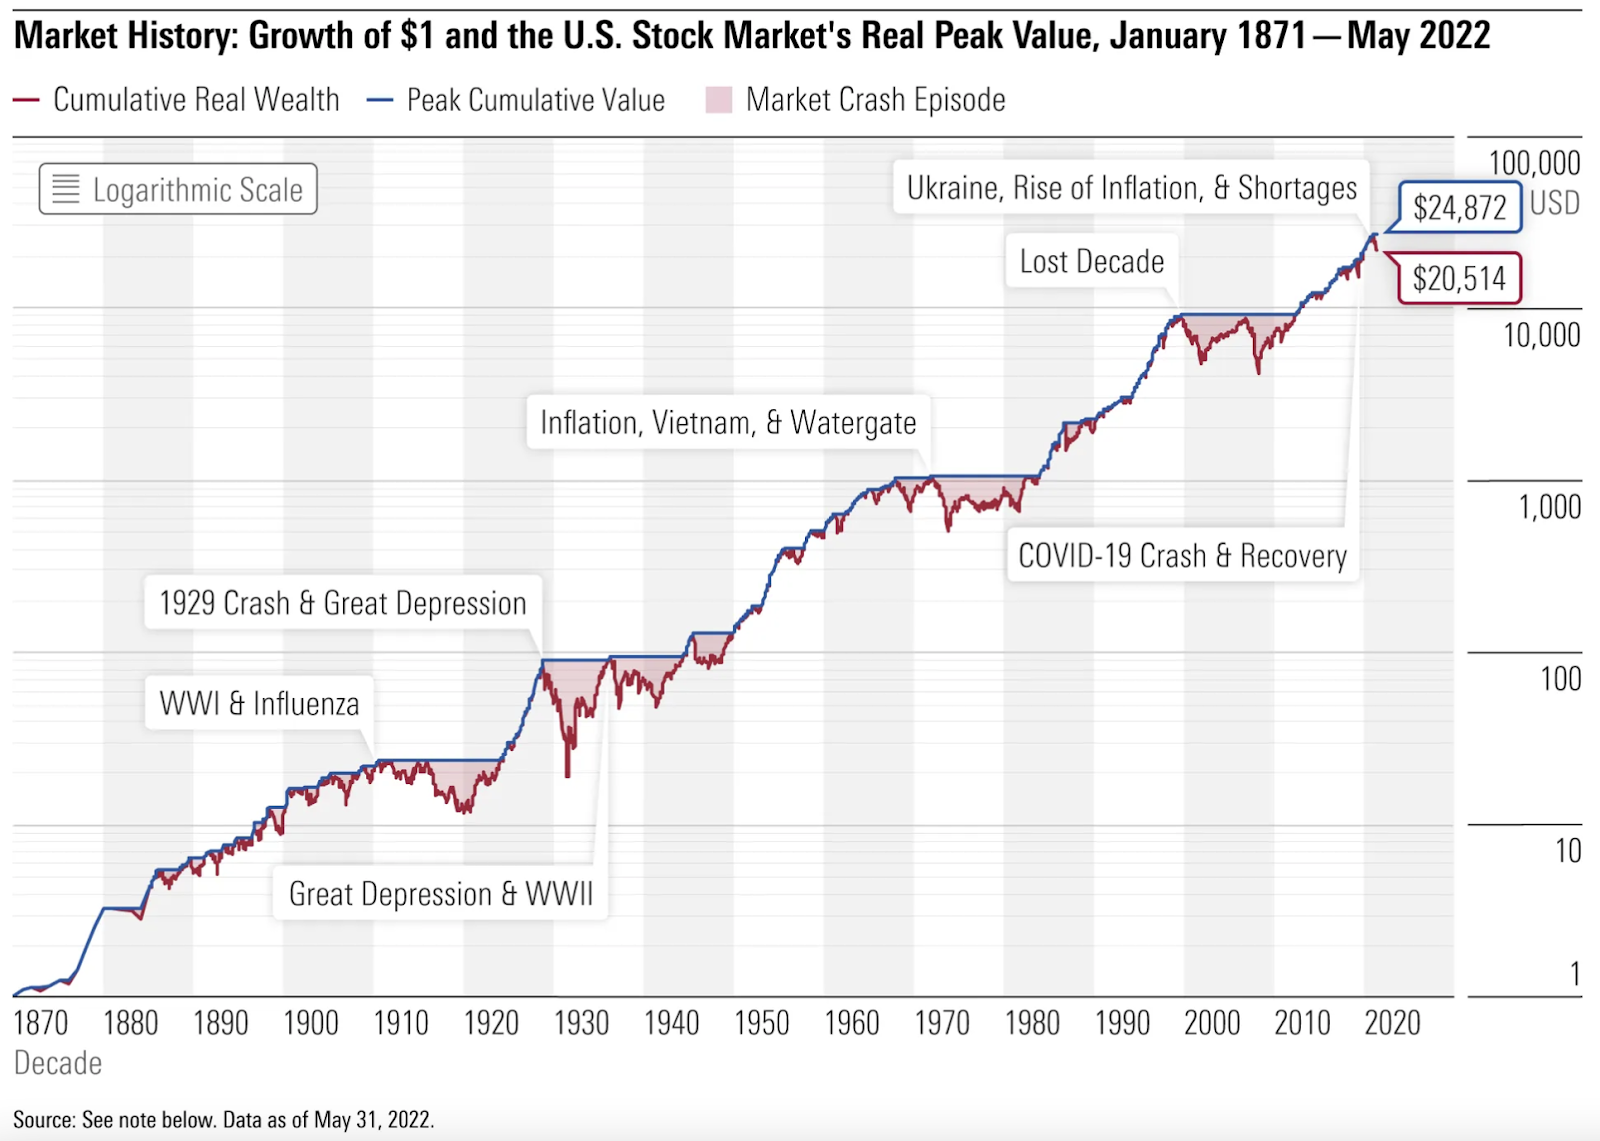
There have been multiple bear markets (>20% decline in stock market) in the 150+ year history of the US stock market, averaging once every 3.5 years. But, in each case, the market eventually recovered and went on to new heights. Despite the downturns, some of which were quite long and severe, $1 invested at the end of 1870 grew to $20,514 in real terms at the end of May 2022. This is a real annual rate of return of 6.8%. More recently, from the lows of the previous ‘lost decade’ from Feb 2009 to May 2022, the market is up more than 400% even after the current drop into an official bear market.
From the chart below, the average length of a bear market was 349 days, while the average length of a bull market was 1,764 days. Similarly, the average loss in a bear market was 36.34% and the average gain during a bull market was 180.04%. While it is hard to predict how long it will take for markets to recover, panic selling should be something you should avoid.
Stay in the race, stay invested
Investing is like running a marathon and requires discipline and stamina. If the current situation makes you nervous, then it is worth re-assessing your risk acceptance levels, investment time horizons and re-evaluate the current exposure of your portfolios to the amount of risks you are willing to undertake. If the current 20% loss makes you anxious, then consider if a 100% equity portfolio is for you and whether you should be looking at less riskier allocations across more stable asset classes. Inflation also poses a challenge to the traditional 60-40 portfolios. Expanding asset allocations to real and alternative assets including commodities, real estate to diversify further, can help to reduce volatility and increase expected returns.
It might sound like boring advice, but stay invested for the long term, and most importantly let the market work for you. One only gets a shot at the prize if you keep yourself in the race.
The author is Ritesh Ganewiral, Head of Investment Advisory, Syfe
