
- The bond market has recently experienced significant fluctuations, with the US 10-Year Treasury yield reaching 5.0%.
- This upward trend is primarily driven by an increase in real yields rather than inflation concerns.
- Currently, bond yields are attractive. The higher yields not only improve the potential returns on bonds but also provide a cushion against possible interest rate hikes.
- Instead of attempting to predict when rates will peak, consider using Dollar Cost Averaging (DCA) with Syfe Income+ Portfolios to build a position in bonds.
The bond market has been on a roller coaster recently. As many headlines have noted, this is the worst bond market rout in 150 years. US government bonds have declined by more than 15% over the past three years. You might be wondering what exactly has happened to the bond market and how you should position your investments. Let’s dive into it.

What has been driving up yields lately?
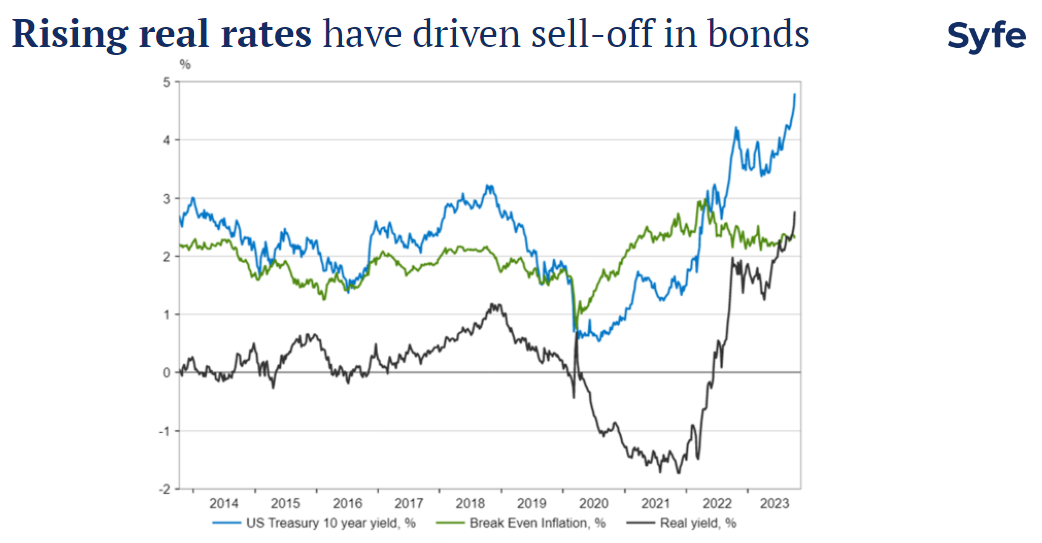
The US 10-Year treasury yield, an indicator closely watched by investors, touched 5% last week. This is an important psychological threshold and also the highest level since 2007.
It is very interesting to note that the recent surge in yield is not driven by inflation concerns, as the break-even inflation has declined since mid-2022. Instead, the upward movement is largely fueled by a rise in real yields, which reflect the market’s expected interest rates after accounting for inflation.
Determining the precise reasons behind this is complex, as the real yield metric involves numerous factors. However, three factors seem to be particularly significant at this juncture.
- The US economy remains surprisingly resilient, with labour markets holding firm and unemployment rates at historic lows. Retail sales are also robust. Many economists and analysts now anticipate a soft-landing scenario and believe that a recession can be avoided.
- Markets are re-calibrating to the new expectation that the policy rates will be higher than market previously thought. The ongoing strength of the US economy has meant that the Fed needs to keep rates higher for longer than expected to cool the economy.
- Markets are concerned about the level of US government debt and the surge in bond issuance. Government borrowing soared during the pandemic and has tapered off as economies have rebounded. However, it has not returned to pre-pandemic levels. Currently, the budget deficit stands at about 7% of GDP, close to what was seen in the aftermath of the global financial crisis in 2008.
Should I Buy or Ditch Bonds?
The answer largely depends on your holding power. A brief recap of Bond 101: bonds behave differently from equities. When you invest in bonds, you are essentially lending money to the issuer, typically a government or corporate. As long as the issuers remain solvent, you will receive both your principal and interest. The prevailing interest rate environment influences interim price movements. However, if you hold the bonds until maturity, these price fluctuations become less concerning.
From a return perspective, bonds are now offering attractive yields. Thanks to the rising yields, you can get 5% on US government bonds, 6.3% on US investment grade corporate bonds and 9.4% on US high yield bonds. Such levels were unfathomable 3-years ago.
Historically, the starting yield levels have shown a significant correlation with the 5-year total return. A high starting yield often suggests that by holding onto the bond for a long enough period to ride out the interest rate cycle, you are likely to see attractive returns.
Not only do these higher yields improve the return outlook, they also help reduce downside risk by providing a buffer should interest rates continue to rise. The tradeoff between return and risk for bonds are generally favourable.
Read more: 5 Reasons Why Now is the Time to Relook Bonds for Passive Income
What Shall I do as the Market Remains Choppy?
Will the interest rates continue to move up, you may ask. It is difficult to ascertain when the Fed will halt its rate hikes, even though we believe that we are approaching the end of this rate-hiking cycle. Predicting when long-end rates will peak is even more challenging. What we can say with certainty, though, is that yields are at a near 20-year high and interest rates typically move in cycles.
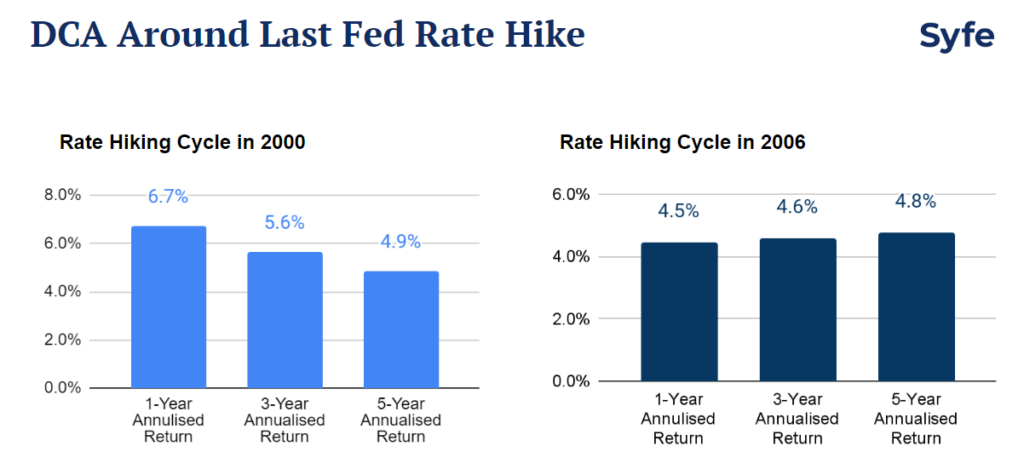
Instead of sitting on the sidelines, DCA could be a strategic approach to build bond positions at this juncture. We analysed the past two rate hike cycles in 2000 and 2006, where the Fed fund rates surpassed 5%. Assuming a DCA approach into a broad bond market (as measured by the BBG Global Aggregate Credit Index) over a 12-month span in the year the Fed halted its rate hikes, the returns (hedged in SGD) over 1-year, 3-year, and 5-year periods are promising in both instances.
It could be an opportune time to employ a DCA strategy to invest in Income+ Portfolios. Following the selloff, the years-to-maturity for the Income+ Preserve and Income+ Enhance portfolios now stand at 7.2% and 8.5%, respectively. Both portfolios maintain an average credit quality above investment grade. They could provide investors the potential for equity-like returns with lower risk by investing in high-quality bonds.
Here is the summary for both portfolios:

Read More:

You must be logged in to post a comment.