
Thought Of The Week
Debt Ceiling Raised, September Jobs Report
Major U.S. stock indexes rose this after lawmakers agreed on a short-term debt-limit extension, potentially putting off a government default standoff for a couple of months. The proposal of raising the debt ceiling to tide the Treasury department until Dec. 3 meant kicking the can down the road and we may be back to the next debt ceiling crisis six weeks later. For now, it removed one of the tail risks that were weighing on stocks in recent weeks.
Meanwhile, U.S job growth fell to the slowest pace of the year in September due to the Delta variant and a persistent shortage of worker. The economy created 194,000 jobs in September, the smallest gain since December 2020 and down from 366,000 jobs added in August. Many workers gave up the job search and exited from the labour force last month, and the smaller pool meant that despite the slowdown in hiring, the unemployment rate fell to 4.8% from 5.2% in August.
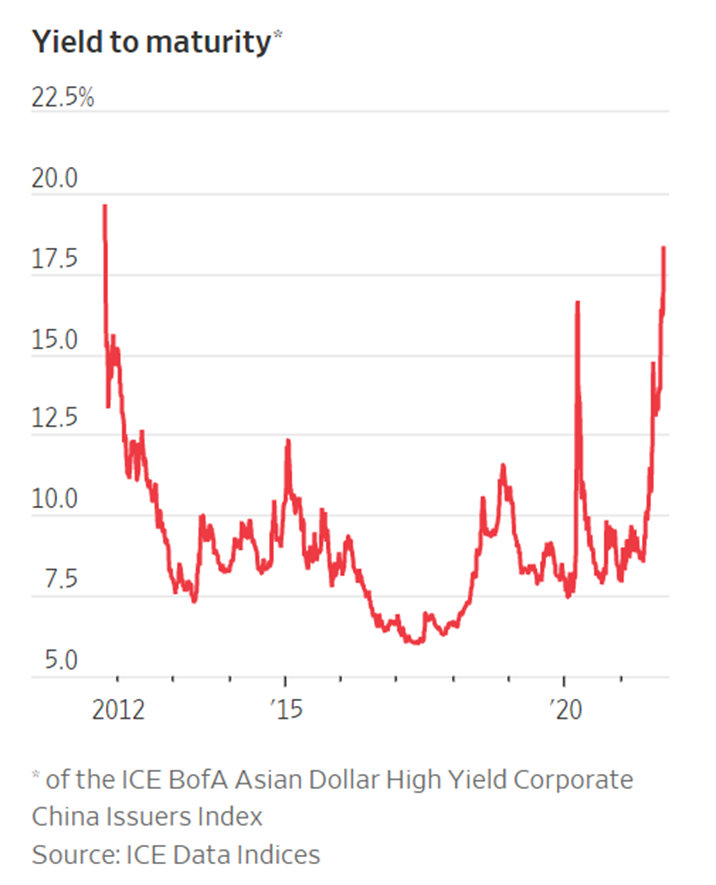
Stress in Chinese High Yield Bonds
Shrinking apartment sales after China Evergrande Group halted unfinished residential projects amid cash shortage and an unexpected default by luxury developer Fantasia Holdings Group Co. have stoked fresh investor concerns about China’s property developers. While Evergrande has a 30-day grace period till end October before declaring a default, there was no grace period for Fantasia’s bond that matured Monday.
This triggered a widespread selloff in many other Chinese developers’ dollar bonds such as Kaisa Group Holdings Ltd., Redsun Properties Group Ltd., and Yuzhou Group Holdings Co., which pushed yields to their highest in nearly 10 years, implying a higher default risk. With China out on its golden week holiday, there was no government intervention announced and thin trading volumes added to the wide spreads. A drawn-out process is likely as markets would need to see government easing of policy, maturing dollar bonds being paid, and Evergrande and Fantasia outlining reasonable restructuring plans before stabilizing.
Global Minimum Tax Rate
Ireland agreed to the global minimum 15% corporate tax rate deal after a yearlong effort driven by U.S to squeeze tax-avoidance arrangements, setting the stage for it to be implemented in 2023. Ireland has been attracting many large U.S technology and pharmaceutical companies as their European headquarters due to its lower 12.5% corporate tax rate since 2003.
A minimum tax rate would see big tech companies paying more tax and existing tax revenues will be divided so that countries where businesses have customers would get more revenue instead of basing it on the intellectual property address. While implementation may be challenging, markets are already assuming the minimum tax rate as part of a broader political trend with focusing on fairness.
Chart Of The Week
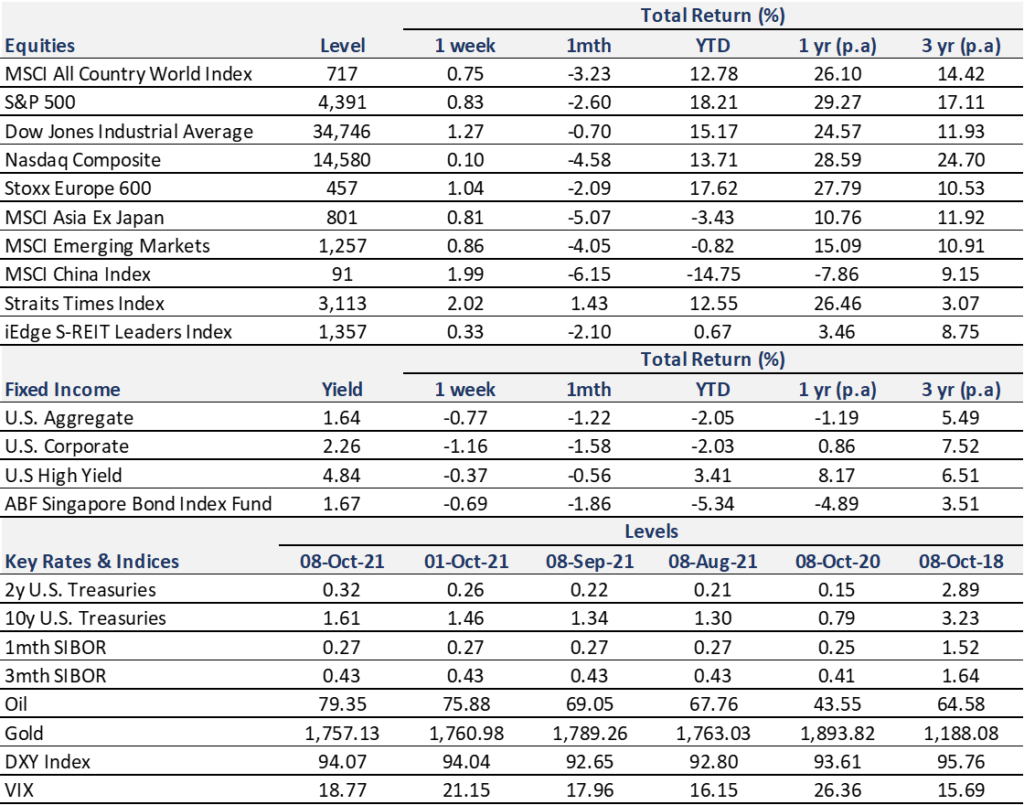
Important Information and Disclosure
Equity Price Level and Returns: All returns represent the total return for stated period. MSCI ACWI: Global equity index provided by Morgan Stanley Capital International (MSCI). S&P 500: Market capitalization index of U.S stocks provided by Standard & Poor’s (S&P). Dow Jones: Price-weighted index of U.S stocks provided by S&P. NASDAQ: Market capitalization index of U.S stocks provided by NASDAQ. Stoxx 600: Market capitalization index of stocks listed in European region. MSCI Asia Ex Japan: Asia excluding Japan equity index provided by MSCI. MSCI EM: Emerging markets equity index provided by MSCI. SSE: Capitalization weighted index of all A-shares and B-shares listed on Shanghai Stock Exchange. STI: Market capitalization index of stocks listed on Singapore Exchange. SREITLSP: Market capitalization index of the most liquid real estate investment trusts in Singapore.
Fixed Income Yield and Returns: All returns represent total return for stated period. Global Aggregate: Global investment grade debt from both developed and emerging markets issuers. U.S. Aggregate, U.S Corporate, High Yield provided by Bloomberg Barclays Indices, ICE Data Services & WSJ. SBIF: ABF Singapore bond index fund provided by Nikko AM.
Key Interest Rates: 2-Year U.S Treasuries, 10 Year Treasuries, Bloomberg. 1-month, 3-month SIBOR: Singapore Interbank Offered Rates provided by Association of Banks in Singapore (ABS). Oil (WTI): Global oil benchmark, Bloomberg. Gold: Gold Spot USD/Oz, Bloomberg. DXY Index: U.S. Dollar Index, Bloomberg. VIX: Expectation of volatility based on S&P index options provided by Chicago Board Options Exchange (CBOE).
The information provided herein is intended for general circulation and/or discussion purposes only. It does not account for the specific investment objectives, financial situation or needs of any individual. The information in this document is not intended to constitute research analysis or recommendation and should not be treated as such.
This does not constitute an offer or solicitation to buy/sell any financial instrument or to participate any investment strategy. No representation or warranty whatsoever (without limiting to accuracy, usefulness, adequacy, timeliness or completeness) in respect of any information (without limiting to any statement, figures, opinion, view or estimate). Syfe does not undertake an obligation to update the information or to correct any inaccuracy that may become apparent at a later time. All information presented is subject to change without notice. Syfe shall not be responsible or liable for any loss or damage whatsoever arising directly or indirectly as a result of any person acting on any information provided herein.
The information provided herein may contain projections or other forward-looking statement regarding future events or future performance of countries, assets, markets or companies. Actual events or results may differ materially. Past performance figures are not necessarily indicative of future of likely performance. Any reference to any specific company, financial product or asset class in whatever way is used for illustrative purposes only and does not constitute a recommendation. Investors should note that there are necessarily limitations and difficulties in using any graph, chart, formula or other device to determine whether or not, or if so, when to, make an investment. The contents hereof are considered proprietary information and may not be produced or disseminated in whole or in part without Syfe’s written consent.

You must be logged in to post a comment.