
Thought Of The Week
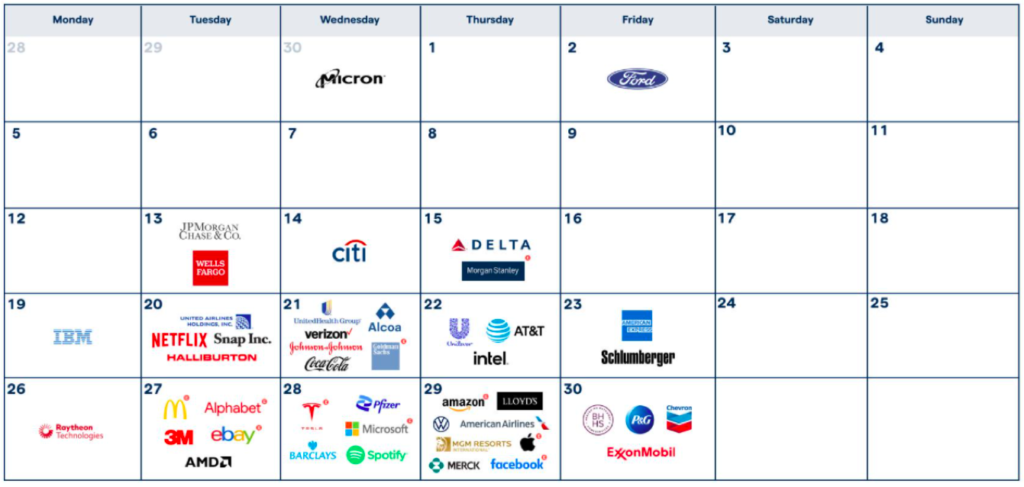
Q2 Earnings Season, CPI Data, Powell Testimony
With a combination of all-time high prices and lofty expectations, companies are facing a tougher bar this earnings season as they will be punished if they disappoint expectations since most of the good news have already been priced in. Big banks kicked off the earnings season this week with Goldman Sachs and JP Morgan topping Wall Street’s expectations, but a closer look shows that the trends that have been contributing to the outperformance are waning (trading activityand and extraordinary items including loan loss reserves). In addition, there are no clear signs on what the next driver for their earnings could be thus leading to a selloff in the sector.
Meanwhile, Federal Reserve Chair Jerome Powell testified during a two-day congressional hearing and as expected, nothing new was said despite a 5.4% increase in CPI from a year earlier. Powell stuck to the same script again and pushed back on inflation fears, assuring markets that inflation is transitory and current accommodative policies will remain. The Fed is currently buying $120 billion of assets per month and has pledged to keep up that pace “until substantial further progress” has been made toward its goals of maximum employment and 2% inflation. The Fed’s stance underscores a growing divergence among global central banks such as New Zealand U.K who are turning hawkish in response to growing price pressures, leaving investors to wonder how long the Fed couldremain dovish. Major U.S indices ended the week lower as markets recalibrate their expectations with base effects becoming less favourable and shortage pressure rotating away from goods towards services.
Rippling Effects of Global Chip Shortage
Due to the lockdowns over the past year, high demand for PCs, phones andgaming consoles has been a big win for the semiconductor industry that produces these tiny chips to power the devices. However, as the demand surge is far outstripping the supply capacity, the world is currently in the grips of a global chip shortage which affects various industries such as automotive and smartphones—though carmakers have it the worst. In its latest earnings release, Taiwan Semiconductor Manufacturing Company (TSMC), the world’s largest chip maker, expects semiconductor supply to remain tight into 2022 and plans to ramp up production by 60%.
Although revenue was reported better than expected, profitability came under pressure as the upfront costs of developing and driving production is dragging its earnings until economies of scale can be achieved. Witha technology lead over its competitors and a well-diversified base including Apple & Nvidia, TSMC is poised to benefit from the stronger demand in smartphones, IoT and automotive-related applications. However, a U.S-China clash over Taiwan remains as one of the world’s biggest geopolitical risks and TSMC could find itself caught in the crossfire. TSMC shares dropped 7% since its earnings release as investors decidedly placed higher emphasis on its weaker margins. The pain extended across the chip sector, with Nvidia, NXP Semiconductors and Micron all down at least 4% for the week.
Chart Of The Week
Important Information and Disclosure
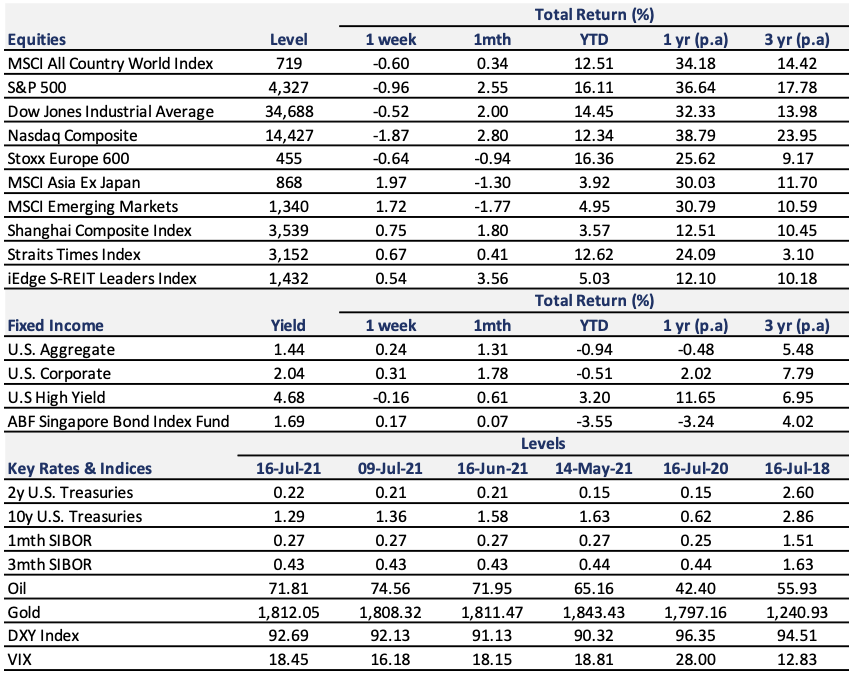
Equity Price Level and Returns: All returns represent the total return for stated period. MSCI ACWI: Global equity index provided by Morgan Stanley Capital International (MSCI). S&P 500: Market capitalization index of U.S stocks provided by Standard & Poor’s (S&P). Dow Jones: Price-weighted index of U.S stocks provided by S&P. NASDAQ: Market capitalization index of U.S stocks provided by NASDAQ. Stoxx 600: Market capitalization index of stocks listed in European region. MSCI Asia Ex Japan: Asia excluding Japan equity index provided by MSCI. MSCI EM: Emerging markets equity index provided by MSCI. SSE: Capitalization weighted index of all A-shares and B-shares listed on Shanghai Stock Exchange. STI: Market capitalization index of stocks listed on Singapore Exchange. SREITLSP: Market capitalization index of the most liquid real estate investment trusts in Singapore.
Fixed Income Yield and Returns: All returns represent total return for stated period. Global Aggregate: Global investment grade debt from both developed and emerging markets issuers. U.S. Aggregate, U.S Corporate, High Yield provided by Bloomberg Barclays Indices, ICE Data Services & WSJ. SBIF: ABF Singapore bond index fund provided by Nikko AM.
Key Interest Rates: 2-Year U.S Treasuries, 10 Year Treasuries, Bloomberg. 1-month, 3-month SIBOR: Singapore Interbank Offered Rates provided by Association of Banks in Singapore (ABS). Oil (WTI): Global oil benchmark, Bloomberg. Gold: Gold Spot USD/Oz, Bloomberg. DXY Index: U.S. Dollar Index, Bloomberg. VIX: Expectation of volatility based on S&P index options provided by Chicago Board Options Exchange (CBOE).
The information provided herein is intended for general circulation and/or discussion purposes only. It does not account for the specific investment objectives, financial situation or needs of any individual. The information in this document is not intended to constitute research analysis or recommendation and should not be treated as such.
This does not constitute an offer or solicitation to buy/sell any financial instrument or to participate any investment strategy. No representation or warranty whatsoever (without limiting to accuracy, usefulness, adequacy, timeliness or completeness) in respect of any information (without limiting to any statement, figures, opinion, view or estimate). Syfe does not undertake an obligation to update the information or to correct any inaccuracy that may become apparent at a later time. All information presented is subject to change without notice. Syfe shall not be responsible or liable for any loss or damage whatsoever arising directly or indirectly as a result of any person acting on any information provided herein.
The information provided herein may contain projections or other forward-looking statement regarding future events or future performance of countries, assets, markets or companies. Actual events or results may differ materially. Past performance figures are not necessarily indicative of future of likely performance. Any reference to any specific company, financial product or asset class in whatever way is used for illustrative purposes only and does not constitute a recommendation. Investors should note that there are necessarily limitations and difficulties in using any graph, chart, formula or other device to determine whether or not, or if so, when to, make an investment. The contents hereof are considered proprietary information and may not be produced or disseminated in whole or in part without Syfe’s written consent.

You must be logged in to post a comment.