
Thought Of The Week
U.S Mixed Economic Data, ECB Meeting
U.S stock indexes closed modestly higher this week amid earnings optimism even though cases of delta variants continue to rise and latest economic data showed mixed signals. Existing-home sales rose 22.9% from a year earlier as continued strong demand pushed the median U.S home price to a record high while jobless claims unexpectedly climbed to 419,000 vs 350,000 estimate. Meanwhile, ECB meeting concluded with a dovish policy guidance to “avoid premature tightening that would be detrimental to the economy” and will keep record-low negative interest rates in place for as long as needed to revive price stability. Lagarde’s remarks reverberated across Europe’s government bond market, with investors piling into the debt of the region’s most economically vulnerable nations such as Italy and Spain.
U.S-China Bilateral Trade
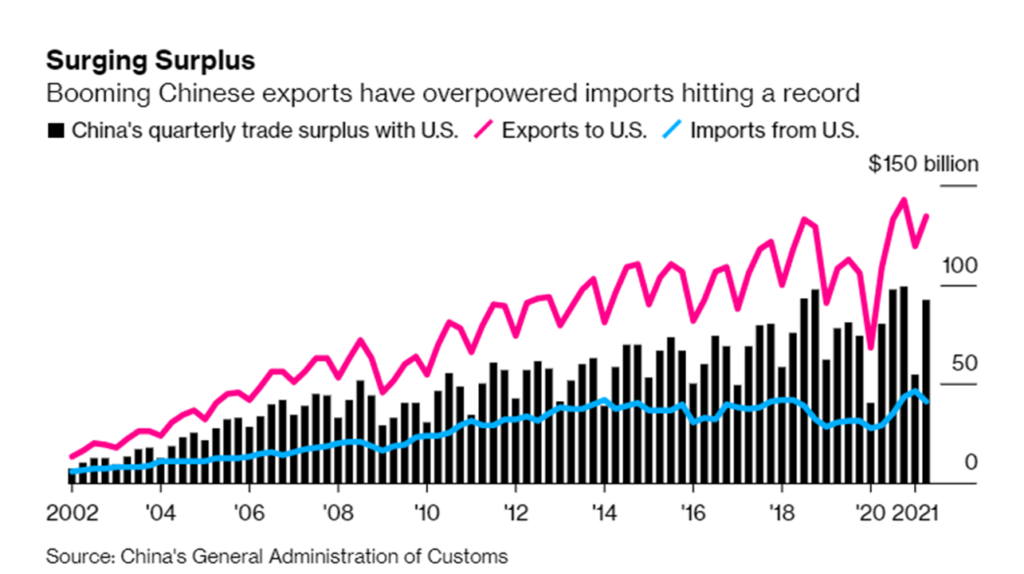
Despite the trade tariffs imposed by the Trump administration 18 months ago and the ongoing tensions over Hong Kong, Taiwan, accusations of technology theft and other flashpoints, U.S and China are still shipping goods to each other at their fastest pace. According to Chinese trade data, bilateral trade has rebounded to fresh records after tumbling to $19 billion last year amid shutdowns in Chinese factories and trade surplus with U.S remains wide even though U.S data tell a much different story. Federal Reserve economists Hunter Clark and Anna Wong argue that the discrepancy was likely due to misreporting by both the Chinese exporters and U.S importers since the Chinese exporters could get higher value-added tax rebates if they over-reported the value of exports while the U.S importers could pay less tariffs if they under-reported the value of goods imported from China.
Although the Biden administration has yet to announce any plans to revamp the existing trade deal, it is evident that winning trade wars with economic barriers such as tariffs would be an arduous journey since the deal did not address the fundamental problems with China. With China nowhere near achieving its purchasing targets for U.S goods by the end of the year and the hard stance by U.S Trade Representative Katherine Tai calling the trade relationship “unbalanced”, trade tensions are likely to continue to linger in the backdrop.
Billionaires Space Travel
Whoever said that money can’t buy happiness probably has not travelled to space. Shortly after Virgin Galactic sent the company’s founder Richard Branson to the edge of space last week, Jeff Bezos, ex-CEO of Amazon and founder of Blue Origin, took the title this week. The capsule touched down safely after reaching an altitude of more than 105 kilometers above ground level which Bezos described the 10-minute flight as his “best day ever” and “more than he’d dreamed of”.
After all, one needs to first bid in an online auction for a ride into space and the winning bid was $28 million. The highly publicized trips demonstrated the potential for space-tourism ventures which are likely to entice wealthy clients to pay big money for a unique travel experience. Meanwhile, China’s ultra-rich are taking a lower profile route by focusing on businesses like satellite manufacturing and rocket launching instead of space tourism. However, it is only a matter of time before these Chinese tycoons commercialize the infrastructure that are being put into place.
Chart Of The Week
Important Information and Disclosure
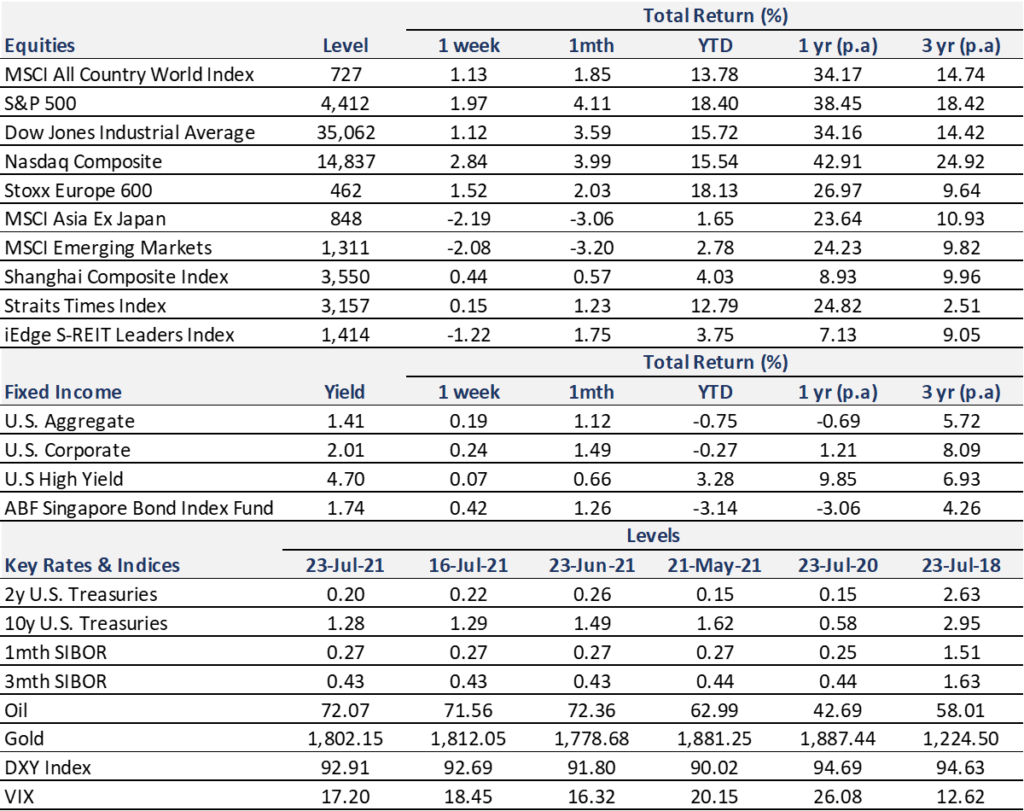
Equity Price Level and Returns: All returns represent the total return for stated period. MSCI ACWI: Global equity index provided by Morgan Stanley Capital International (MSCI). S&P 500: Market capitalization index of U.S stocks provided by Standard & Poor’s (S&P). Dow Jones: Price-weighted index of U.S stocks provided by S&P. NASDAQ: Market capitalization index of U.S stocks provided by NASDAQ. Stoxx 600: Market capitalization index of stocks listed in European region. MSCI Asia Ex Japan: Asia excluding Japan equity index provided by MSCI. MSCI EM: Emerging markets equity index provided by MSCI. SSE: Capitalization weighted index of all A-shares and B-shares listed on Shanghai Stock Exchange. STI: Market capitalization index of stocks listed on Singapore Exchange. SREITLSP: Market capitalization index of the most liquid real estate investment trusts in Singapore.
Fixed Income Yield and Returns: All returns represent total return for stated period. Global Aggregate: Global investment grade debt from both developed and emerging markets issuers. U.S. Aggregate, U.S Corporate, High Yield provided by Bloomberg Barclays Indices, ICE Data Services & WSJ. SBIF: ABF Singapore bond index fund provided by Nikko AM.
Key Interest Rates: 2-Year U.S Treasuries, 10 Year Treasuries, Bloomberg. 1-month, 3-month SIBOR: Singapore Interbank Offered Rates provided by Association of Banks in Singapore (ABS). Oil (WTI): Global oil benchmark, Bloomberg. Gold: Gold Spot USD/Oz, Bloomberg. DXY Index: U.S. Dollar Index, Bloomberg. VIX: Expectation of volatility based on S&P index options provided by Chicago Board Options Exchange (CBOE).
The information provided herein is intended for general circulation and/or discussion purposes only. It does not account for the specific investment objectives, financial situation or needs of any individual. The information in this document is not intended to constitute research analysis or recommendation and should not be treated as such.
This does not constitute an offer or solicitation to buy/sell any financial instrument or to participate any investment strategy. No representation or warranty whatsoever (without limiting to accuracy, usefulness, adequacy, timeliness or completeness) in respect of any information (without limiting to any statement, figures, opinion, view or estimate). Syfe does not undertake an obligation to update the information or to correct any inaccuracy that may become apparent at a later time. All information presented is subject to change without notice. Syfe shall not be responsible or liable for any loss or damage whatsoever arising directly or indirectly as a result of any person acting on any information provided herein.
The information provided herein may contain projections or other forward-looking statement regarding future events or future performance of countries, assets, markets or companies. Actual events or results may differ materially. Past performance figures are not necessarily indicative of future of likely performance. Any reference to any specific company, financial product or asset class in whatever way is used for illustrative purposes only and does not constitute a recommendation. Investors should note that there are necessarily limitations and difficulties in using any graph, chart, formula or other device to determine whether or not, or if so, when to, make an investment. The contents hereof are considered proprietary information and may not be produced or disseminated in whole or in part without Syfe’s written consent.

You must be logged in to post a comment.