
Thought Of The Week
FOMC Meeting, Big Tech Earnings
Markets were whipsawed this week as market participants juggled with China’s clampdown, earnings season, delta virus variant and central banks’ policies. There was little surprise from Fed’s July statement on interest rate and tapering since it has repeatedly emphasized its accommodative stance until unemployment comes down which translates to 7 more million jobs to be filled. Even though Fed has begun to discuss the timing and pace of easing off stimulus, it is unlikely to have a sustainable risk of a major correction for the U.S market given tremendous liquidity and sustained earnings growth from index companies. Rather, scaling back bond purchases later this year should prevent growth from overheating.
Meanwhile, megacap technology companies reported strong-than-estimates earnings but weaker forward guidance and slowing growth which capped tech-heavy Nasdaq. As the economy opens and vaccinated consumers revert to old habits like traveling and dining out, tailwinds that supported megacaps last year dissipated.
Wild Week for Chinese Stocks
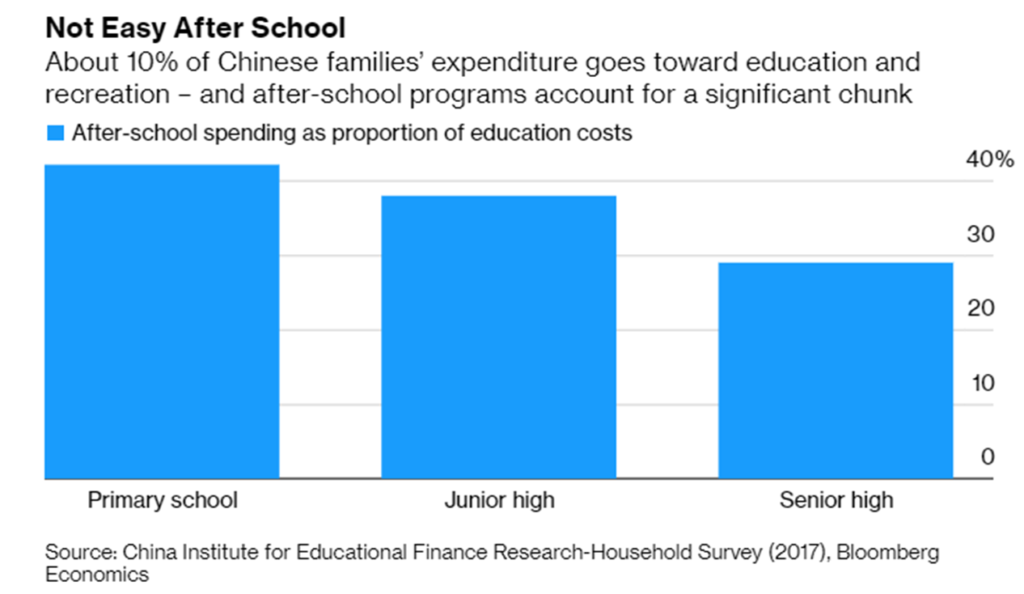
China’s sweeping clampdowns on technology, ride-hailing, food delivery and education led a broad sell-off in Chinese stocks this week, leaving investors worried how much further the regulatory onslaught would go. Afterall, if a document can make an industry disappear directly, investors will not want to invest in the long-term. Since 2013, education expenditure has been outpacing income growth for households and China government is now concerned that this may affect social equality and stability with more Chinese youths choosing to “lie flat” – a sign of the intense social competition that people are tired of and want to escape from. As education accounts for only 4% of GDP, it seems doable for the Chinese government to intervene directly and force these after-school tutoring/ private education companies to register as non-profit. The negative sentiment and concerns that the crackdown will spill over into other sectors such as Healthcare and Technology escalated quickly, and it was extreme panic. The oversold situation in Hong Kong was like in 2015 when the China market crashed due to policies, and the oversold situation in Tencent was like in the 2008 financial tsunami.
The steep sell-off seems to be a shock to the Chinese government as regulators quickly stepped in to recommit its support for small and medium enterprises to access the capital market while Xinhua News Agency commented that the regulations on tech platforms and off-campus training institutions are aimed at healthy development. Although it remains unclear if the regulatory crackdown will extend to other industries which increases the risk premium, it is important to hold a longer-term view on China since its GDP growth remains the highest across all the big economies and is the melting pot of thematic growth across all the key trends such as renewables, healthcare and digitization.
Chart Of The Week
Important Information and Disclosure
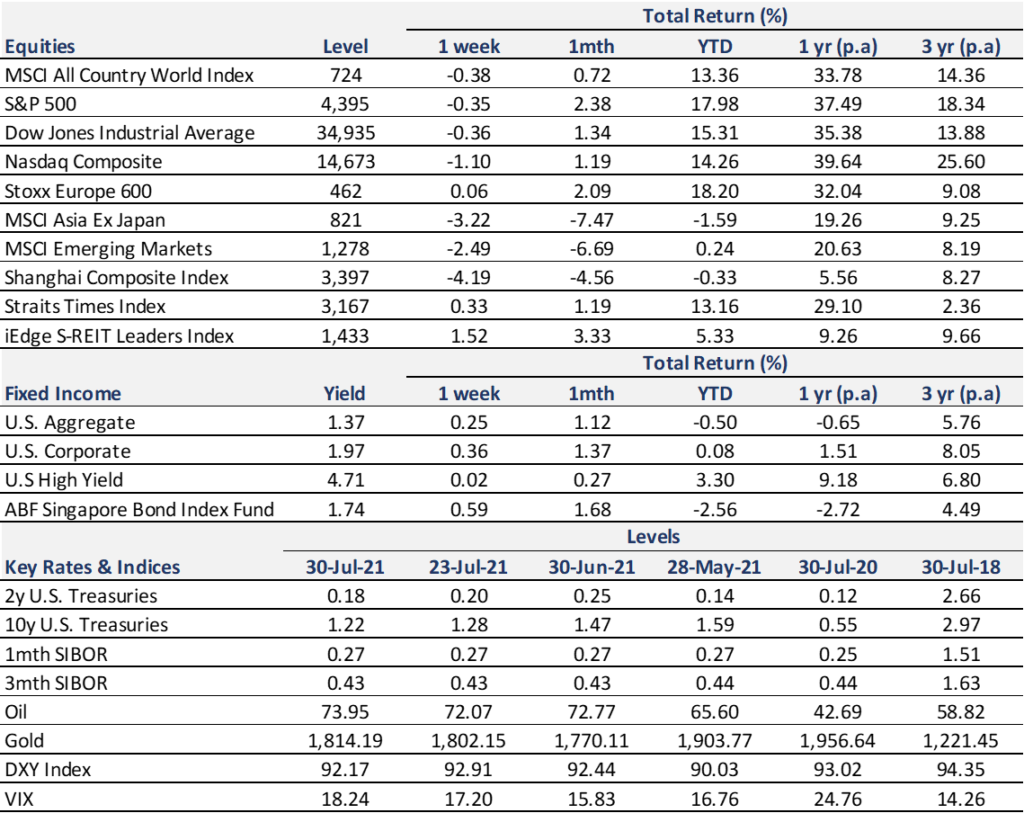
Equity Price Level and Returns: All returns represent the total return for stated period. MSCI ACWI: Global equity index provided by Morgan Stanley Capital International (MSCI). S&P 500: Market capitalization index of U.S stocks provided by Standard & Poor’s (S&P). Dow Jones: Price-weighted index of U.S stocks provided by S&P. NASDAQ: Market capitalization index of U.S stocks provided by NASDAQ. Stoxx 600: Market capitalization index of stocks listed in European region. MSCI Asia Ex Japan: Asia excluding Japan equity index provided by MSCI. MSCI EM: Emerging markets equity index provided by MSCI. SSE: Capitalization weighted index of all A-shares and B-shares listed on Shanghai Stock Exchange. STI: Market capitalization index of stocks listed on Singapore Exchange. SREITLSP: Market capitalization index of the most liquid real estate investment trusts in Singapore.
Fixed Income Yield and Returns: All returns represent total return for stated period. Global Aggregate: Global investment grade debt from both developed and emerging markets issuers. U.S. Aggregate, U.S Corporate, High Yield provided by Bloomberg Barclays Indices, ICE Data Services & WSJ. SBIF: ABF Singapore bond index fund provided by Nikko AM.
Key Interest Rates: 2-Year U.S Treasuries, 10 Year Treasuries, Bloomberg. 1-month, 3-month SIBOR: Singapore Interbank Offered Rates provided by Association of Banks in Singapore (ABS). Oil (WTI): Global oil benchmark, Bloomberg. Gold: Gold Spot USD/Oz, Bloomberg. DXY Index: U.S. Dollar Index, Bloomberg. VIX: Expectation of volatility based on S&P index options provided by Chicago Board Options Exchange (CBOE).
The information provided herein is intended for general circulation and/or discussion purposes only. It does not account for the specific investment objectives, financial situation or needs of any individual. The information in this document is not intended to constitute research analysis or recommendation and should not be treated as such.
This does not constitute an offer or solicitation to buy/sell any financial instrument or to participate any investment strategy. No representation or warranty whatsoever (without limiting to accuracy, usefulness, adequacy, timeliness or completeness) in respect of any information (without limiting to any statement, figures, opinion, view or estimate). Syfe does not undertake an obligation to update the information or to correct any inaccuracy that may become apparent at a later time. All information presented is subject to change without notice. Syfe shall not be responsible or liable for any loss or damage whatsoever arising directly or indirectly as a result of any person acting on any information provided herein.
The information provided herein may contain projections or other forward-looking statement regarding future events or future performance of countries, assets, markets or companies. Actual events or results may differ materially. Past performance figures are not necessarily indicative of future of likely performance. Any reference to any specific company, financial product or asset class in whatever way is used for illustrative purposes only and does not constitute a recommendation. Investors should note that there are necessarily limitations and difficulties in using any graph, chart, formula or other device to determine whether or not, or if so, when to, make an investment. The contents hereof are considered proprietary information and may not be produced or disseminated in whole or in part without Syfe’s written consent.

You must be logged in to post a comment.