
Thought Of The Week
Fed Signals for Tapering, Expects Slower Growth
The US Federal Reserve signalled that it was ready to start reversing its pandemic stimulus programs and could raise interest rates next year amid risks of a lengthier-than-anticipated jump in inflation.
In its post-meeting statement released on Wednesday, the Fed indicated that it would begin reducing its monthly purchases of $120 billion worth of Treasury and mortgage-backed securities as soon as its next scheduled meeting, Nov. 2-3, and it would “conclude around the middle of next year.” This will give the officials greater flexibility to raise rates sooner if inflation appears to defy earlier expectations that it will return more quickly to the Fed’s 2% goal.
While Fed Chairman Jerome Powell dismissed talk about rate increases by describing the more stringent conditions to be met, the new dot plot showed half of the officials eyeing interest rates increases by the end of 2022. Rising prices and continued supply chain disruptions due to Delta variants were cited for keeping inflation elevated.
Major U.S. indexes closed slightly positive flat for the week and the yield on the 10-year Treasury note ticked up to 1.45% as markets shrugged off concerns over a Federal Reserve pullback in stimulus, contagion risks from distressed developer China Evergrande Group and Beijing’s latest crackdown on cryptocurrencies.
Impact of Evergrande Crisis
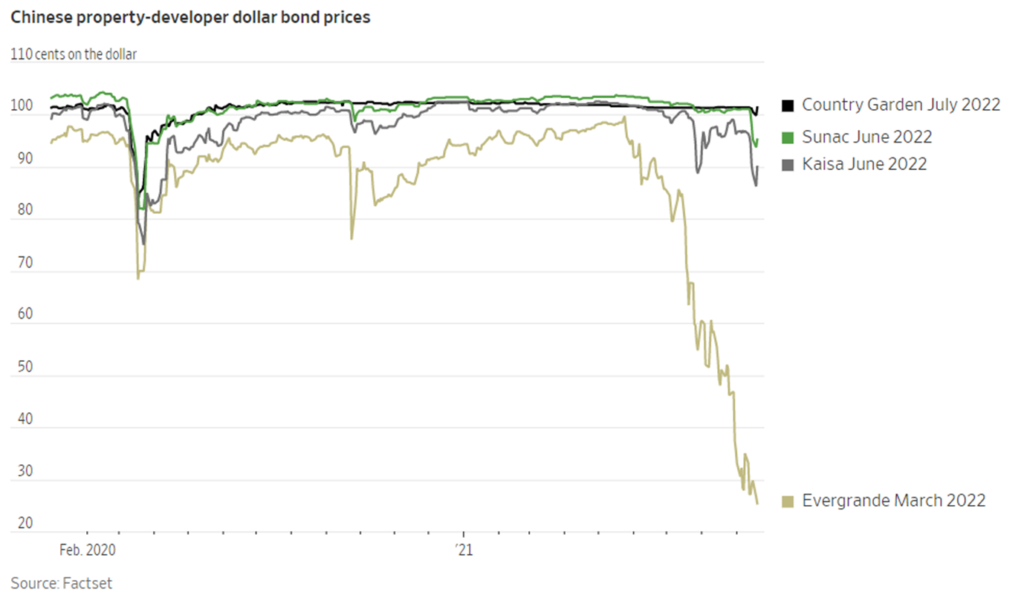
The troubles engulfing Chinese property developer Evergrande have prompted comparisons to the failure of Lehman Brothers in 2008. While most investors doubt it would be a replay of the Lehman’s collapse given Beijing’s extraordinary control on the economy’s financial system, others are concerned about the lack of communication from Chinese authorities. So far, local governments have only been tasked with preventing unrest and mitigating rippling effects on homebuyers, suggesting Beijing’s reluctance to bail out the debt-saddled property developer.
Investors would now have to contend with the short-term risks of spillovers from Evergrande while assessing the longer-term effects from the shift in China’s economic model. Both could have serious implications for the rest of the world. The worst-case short-term impact from Evergrande’s collapse could chase investors away from other publicly traded developers and suppliers of building materials. As housing and land prices crash, Chinese savers may find the empty apartments they invested in are worth less than they paid.
On the global scale, the weakened real estate sentiment will translate to a drag on economies that depend on China’s demand for coal, iron ore and other commodities such as Australia and Brazil. Foreign investors who made concentrated bets on Chinese stocks or bonds could also pull back from stocks and riskier bonds amid concerns of a wider financial meltdown.
That said, we do not expect Evergrande bonds to create drastic spillovers and effects would be largely contained to companies with close links to the developer. A drawn-out process is more likely as regulators continue to nudge Evergrande to save itself first through asset disposals and negotiations, while stepping in to provide some liquidity and market stabilization measures. A rescue from the coalition of state-backed strategic investors will only be used much later as the last measure if the situation spirals out of control.
Chart Of The Week
Important Information and Disclosure
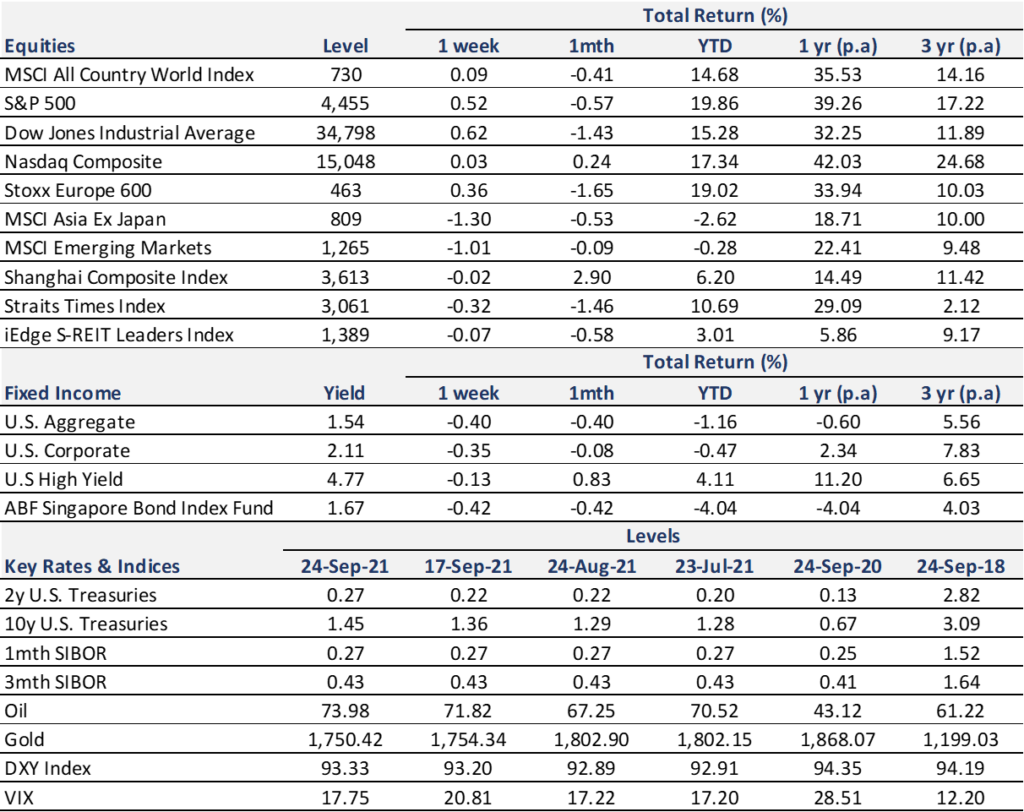
Equity Price Level and Returns: All returns represent the total return for stated period. MSCI ACWI: Global equity index provided by Morgan Stanley Capital International (MSCI). S&P 500: Market capitalization index of U.S stocks provided by Standard & Poor’s (S&P). Dow Jones: Price-weighted index of U.S stocks provided by S&P. NASDAQ: Market capitalization index of U.S stocks provided by NASDAQ. Stoxx 600: Market capitalization index of stocks listed in European region. MSCI Asia Ex Japan: Asia excluding Japan equity index provided by MSCI. MSCI EM: Emerging markets equity index provided by MSCI. SSE: Capitalization weighted index of all A-shares and B-shares listed on Shanghai Stock Exchange. STI: Market capitalization index of stocks listed on Singapore Exchange. SREITLSP: Market capitalization index of the most liquid real estate investment trusts in Singapore.
Fixed Income Yield and Returns: All returns represent total return for stated period. Global Aggregate: Global investment grade debt from both developed and emerging markets issuers. U.S. Aggregate, U.S Corporate, High Yield provided by Bloomberg Barclays Indices, ICE Data Services & WSJ. SBIF: ABF Singapore bond index fund provided by Nikko AM.
Key Interest Rates: 2-Year U.S Treasuries, 10 Year Treasuries, Bloomberg. 1-month, 3-month SIBOR: Singapore Interbank Offered Rates provided by Association of Banks in Singapore (ABS). Oil (WTI): Global oil benchmark, Bloomberg. Gold: Gold Spot USD/Oz, Bloomberg. DXY Index: U.S. Dollar Index, Bloomberg. VIX: Expectation of volatility based on S&P index options provided by Chicago Board Options Exchange (CBOE).
The information provided herein is intended for general circulation and/or discussion purposes only. It does not account for the specific investment objectives, financial situation or needs of any individual. The information in this document is not intended to constitute research analysis or recommendation and should not be treated as such.
This does not constitute an offer or solicitation to buy/sell any financial instrument or to participate any investment strategy. No representation or warranty whatsoever (without limiting to accuracy, usefulness, adequacy, timeliness or completeness) in respect of any information (without limiting to any statement, figures, opinion, view or estimate). Syfe does not undertake an obligation to update the information or to correct any inaccuracy that may become apparent at a later time. All information presented is subject to change without notice. Syfe shall not be responsible or liable for any loss or damage whatsoever arising directly or indirectly as a result of any person acting on any information provided herein.
The information provided herein may contain projections or other forward-looking statement regarding future events or future performance of countries, assets, markets or companies. Actual events or results may differ materially. Past performance figures are not necessarily indicative of future of likely performance. Any reference to any specific company, financial product or asset class in whatever way is used for illustrative purposes only and does not constitute a recommendation. Investors should note that there are necessarily limitations and difficulties in using any graph, chart, formula or other device to determine whether or not, or if so, when to, make an investment. The contents hereof are considered proprietary information and may not be produced or disseminated in whole or in part without Syfe’s written consent.

You must be logged in to post a comment.