
The Week Ahead
- Europe CPI (Jan)
- US Q4 GDP
- US Federal Budget
Thought Of The Week
2021 Singapore Budget: Emerging Stronger Together
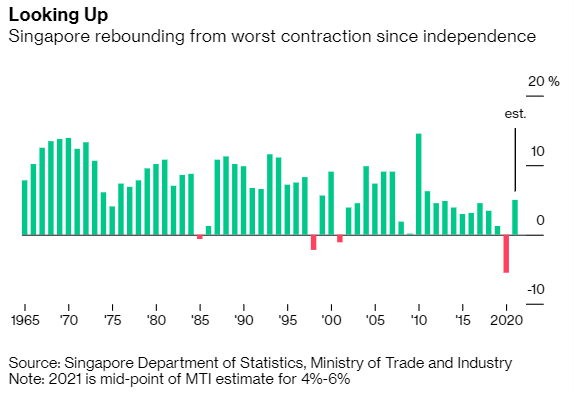
Finance Minister Heng Swee Keat unveiled a new $11 billion package in the annual budget speech to Parliament on Tuesday, focused on helping households and businesses hurt by the pandemic. This aid comes after Singapore’s GDP shrank by 5.4% in 2020, its biggest contraction since independence, which will be funded by tapping its reserves and running a budget deficit of 2.2% of its GDP.
Market watchers remain sceptical that this will benefit the Straits Times Index as a whole and expect certain sectors to do better as the budget was seen to be more targeted instead of a blanket help.
Key beneficiaries include aviation, green businesses and infrastructure from the extension of cost reliefs and issuance of green bonds to finance the selected public infrastructure projects. On the other hand, real estate-related stocks drifted lower as the proposed support for the sector was not as aggressive and the rental relief measures did not come through as markets expected, leaving the dry powder to be kept for other rainy days.
Other key points from the budget speech include upgrading the skills of local workers, tightening hiring of foreigners in the manufacturing sector and raising Goods-and-Services Tax (GST) between 2022 to 2025. The new tax will be imposed on low-value goods imported via post or air as well as business-to-consumer (B2C) services supplied over the Internet or other electronic network that require human intervention. This could weigh on consumers’ pocket going forward but it remains to be seen if it could be a positive for the brick-and-mortar retailers that have been beaten down.
Deep Freeze in U.S, Oil Market Crisis, Yields Creep Higher
The unprecedented freezing temperatures in southern United States continue to cripple power systems, affecting 3 million homes and business to go without electricity on Wednesday. Although this figure is set to ease in the coming days as the lost power are being restored, the potential of a prolonged fuel shortage has started to cause rippling effects in the oil market.
More than 4 million barrels of daily output are down, which is almost 40% of nation’s crude production, and several companies have claimed forced majeure warning that they will not be able to meet deliveries under contract. Oil refineries and gas pipelines in the region are left frozen in the cold snap and are expected to be down for weeks of repairs.
As a result of the supply shock, Texas Governor Greg Abbott signed an order restricting the flow of natural gas across state lines and demanded lawmakers to make winterization of power plants mandatory. Brent crude briefly surged above $65 a barrel on Thursday, a level not seen since last January and the spreads indicating supply tightness also soared. Ten months ago, the price slumped below $16 because of a demand shock caused by Covid-19.
Meanwhile, U.S Treasury yields climbed to its highest level since last February at 1.3364 as investors try to price the impact of a yet-to-be completed $1.9 trillion stimulus bill and vaccine progress amid the fragility of the growth backdrop.
Chart Of The Week
Important Information and Disclosure
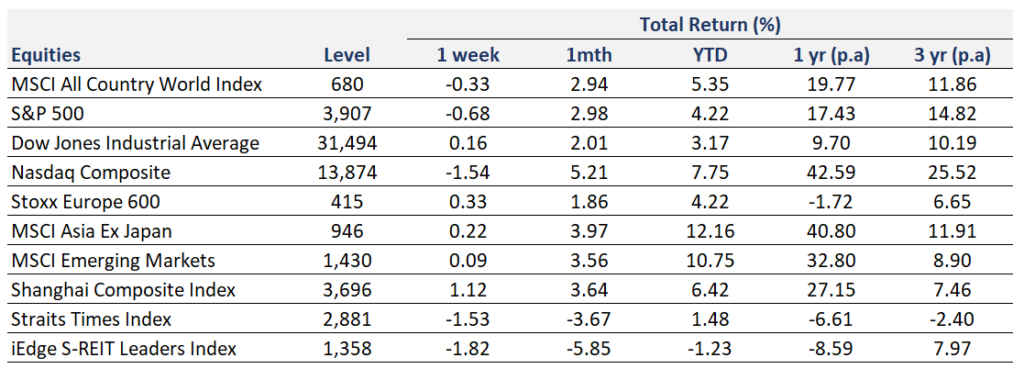
Equity Price Level and Returns: All returns represent the total return for stated period. MSCI ACWI: Global equity index provided by Morgan Stanley Capital International (MSCI). S&P 500: Market capitalization index of U.S stocks provided by Standard & Poor’s (S&P). Dow Jones: Price-weighted index of U.S stocks provided by S&P. NASDAQ: Market capitalization index of U.S stocks provided by NASDAQ. Stoxx 600: Market capitalization index of stocks listed in European region. MSCI Asia Ex Japan: Asia excluding Japan equity index provided by MSCI. MSCI EM: Emerging markets equity index provided by MSCI. SSE: Capitalization weighted index of all A-shares and B-shares listed on Shanghai Stock Exchange. STI: Market capitalization index of stocks listed on Singapore Exchange. SREITLSP: Market capitalization index of the most liquid real estate investment trusts in Singapore.
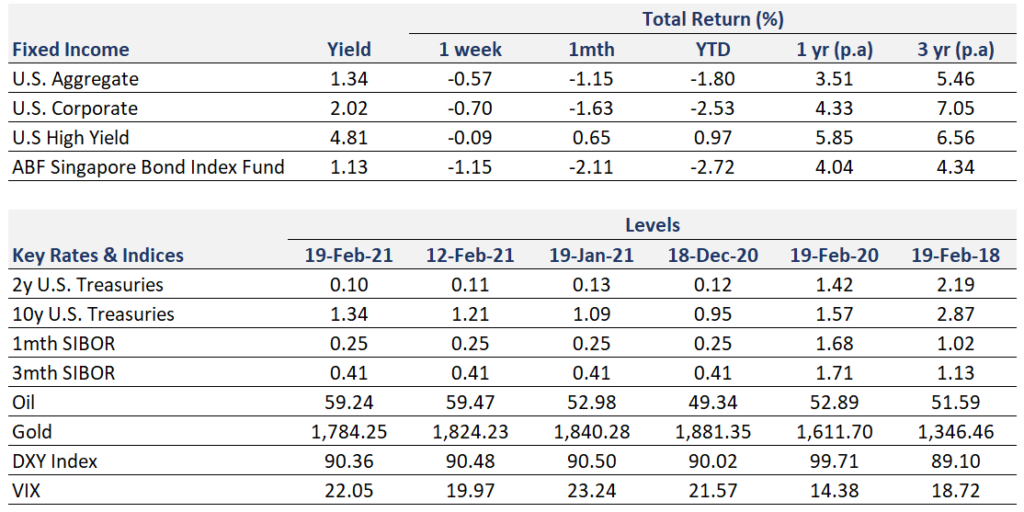
Fixed Income Yield and Returns: All returns represent total return for stated period. Global Aggregate: Global investment grade debt from both developed and emerging markets issuers. U.S. Aggregate, U.S Corporate, High Yield provided by Bloomberg Barclays Indices, ICE Data Services & WSJ. SBIF: ABF Singapore bond index fund provided by Nikko AM.
Key Interest Rates: 2-Year U.S Treasuries, 10 Year Treasuries, Bloomberg. 1-month, 3-month SIBOR: Singapore Interbank Offered Rates provided by Association of Banks in Singapore (ABS). Oil (WTI): Global oil benchmark, Bloomberg. Gold: Gold Spot USD/Oz, Bloomberg. DXY Index: U.S. Dollar Index, Bloomberg. VIX: Expectation of volatility based on S&P index options provided by Chicago Board Options Exchange (CBOE).
The information provided herein is intended for general circulation and/or discussion purposes only. It does not account for the specific investment objectives, financial situation or needs of any individual. The information in this document is not intended to constitute research analysis or recommendation and should not be treated as such.
This does not constitute an offer or solicitation to buy/sell any financial instrument or to participate any investment strategy. No representation or warranty whatsoever (without limiting to accuracy, usefulness, adequacy, timeliness or completeness) in respect of any information (without limiting to any statement, figures, opinion, view or estimate). Syfe does not undertake an obligation to update the information or to correct any inaccuracy that may become apparent at a later time. All information presented is subject to change without notice. Syfe shall not be responsible or liable for any loss or damage whatsoever arising directly or indirectly as a result of any person acting on any information provided herein.
The information provided herein may contain projections or other forward-looking statement regarding future events or future performance of countries, assets, markets or companies. Actual events or results may differ materially. Past performance figures are not necessarily indicative of future of likely performance. Any reference to any specific company, financial product or asset class in whatever way is used for illustrative purposes only and does not constitute a recommendation. Investors should note that there are necessarily limitations and difficulties in using any graph, chart, formula or other device to determine whether or not, or if so, when to, make an investment. The contents hereof are considered proprietary information and may not be produced or disseminated in whole or in part without Syfe’s written consent.

You must be logged in to post a comment.