
Thought Of The Week
U.S Budget Reconciliation, Reddit Bubbles Burst, Market Manipulation
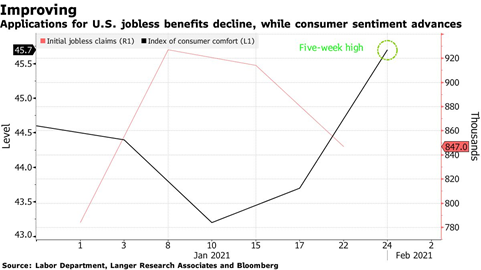
U.S economy continued to show scattered signs of recovery as more Americans get inoculated and business restrictions are being eased. Initial jobless claims declined for the third straight week and other data such as consumer confidence readings and restaurant bookings also showed positive signs. This might hinder President Biden’s plan of going big as opponents argue it may overshoot and result in inflation. Nonetheless, Senate is trying to clear the way for the bill to be passed with a simple majority rather than the 60-vote threshold as 10 million Americans are still out of work due to Covid-19.
Meanwhile, shares of GameStop fell rapidly back to earth after two weeks of volatile trading, erasing 81% from its peak. The frenzy has also caught the attention of federal regulators and the Securities and Exchange Commission investigators will be scrutinising social media posts for signs of misinformation that manipulated the market.
While the zero-fee platform democratized the stock market in many ways, the Robinhood crisis also demonstrated that such a frictionless platform can warp investor’s behaviour and undermine confidence when the bubble bursts. Monetary Authority of Singapore (MAS) also issued a similar warning on Tuesday that it be will closely monitoring the possibility of these platforms inciting herd behaviour happening in Singapore.
Call in the Technocrat
A technocrat refers to someone who has political power because of their knowledge. When they are called in, it means that things are really bad. Former European Central Bank (ECB) President Mario Dragi was hauled out of retirement on Wednesday to form a new government to lead Italy out of the turmoil. Italy has been a troubled economy with rising debt, low productivity and fragmented parliament. With the pandemic dealing another blow to the crippled economy, Dragi will need to leverage on his credibility to push through controversial policies such as spending more to revamp the economy despite its record debt levels. Dragi is the fourth technocrat appointed to fix the Italy’s dysfunctions over the last three decades and has a very tough job ahead.
A-Listers: Amazon, Alphabet, Alibaba
The tech giants reported their earnings for the fourth quarter earnings of 2020 this week and as expected, they remain unstoppable. Amazon recorded $126 billion revenue for the quarter, the first time in the company’s history to pass the $100 billion mark. With that stunning achievement, it is no wonder that CEO Jeff Bezos will be handing the driving seat to Andy Jassy to drive the next growth in cloud computing.
Alphabet’s revenue also grew by 23%, led by a strong recovery in its advertising business after a slowdown in Q2, sending its stock price up 10% for the week. Joining its peers, Alibaba topped earnings and revenue expectations with its cloud computing business reporting its first profitable quarter. Jack Ma, on the other hand, found himself in a different fate as he was dropped out of the list that celebrates Chinese entrepreneurs by the state media, underscoring how far he has fallen out of favour with Beijing.
Chart Of The Week
Important Information and Disclosure
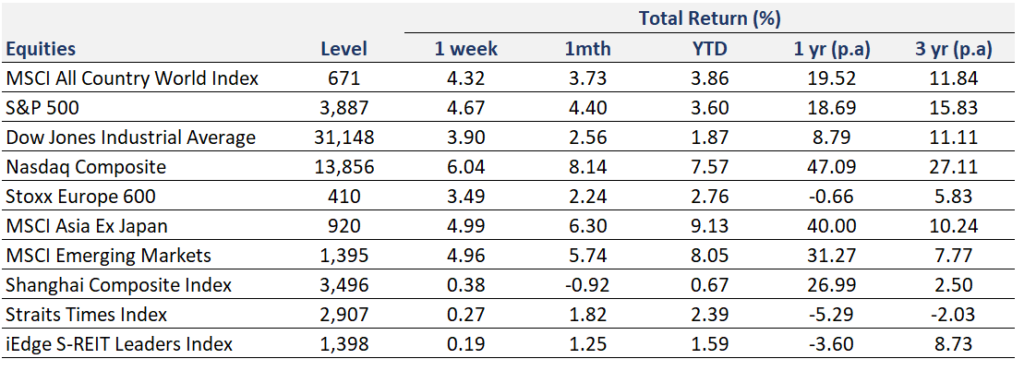
Equity Price Level and Returns: All returns represent the total return for stated period. MSCI ACWI: Global equity index provided by Morgan Stanley Capital International (MSCI). S&P 500: Market capitalization index of U.S stocks provided by Standard & Poor’s (S&P). Dow Jones: Price-weighted index of U.S stocks provided by S&P. NASDAQ: Market capitalization index of U.S stocks provided by NASDAQ. Stoxx 600: Market capitalization index of stocks listed in European region. MSCI Asia Ex Japan: Asia excluding Japan equity index provided by MSCI. MSCI EM: Emerging markets equity index provided by MSCI. SSE: Capitalization weighted index of all A-shares and B-shares listed on Shanghai Stock Exchange. STI: Market capitalization index of stocks listed on Singapore Exchange. SREITLSP: Market capitalization index of the most liquid real estate investment trusts in Singapore.
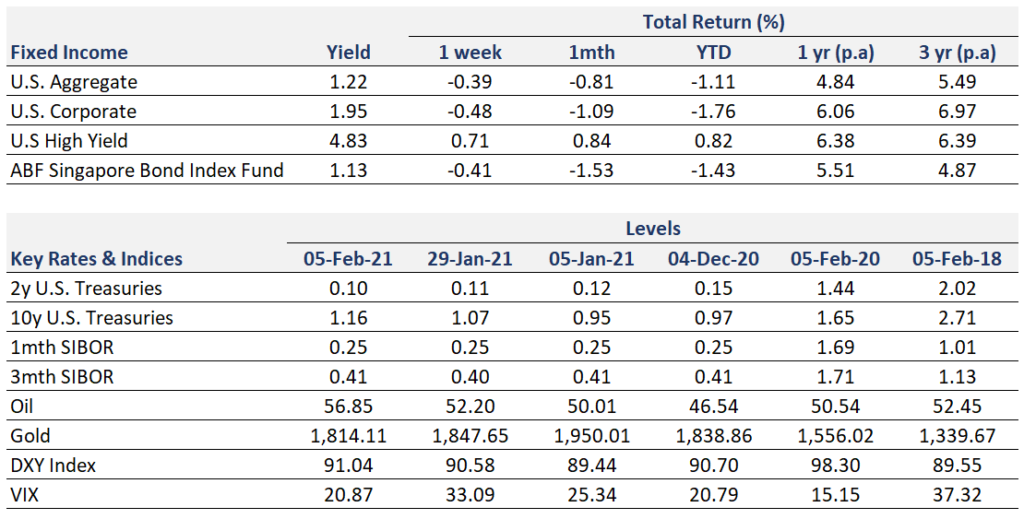
Fixed Income Yield and Returns: All returns represent total return for stated period. Global Aggregate: Global investment grade debt from both developed and emerging markets issuers. U.S. Aggregate, U.S Corporate, High Yield provided by Bloomberg Barclays Indices, ICE Data Services & WSJ. SBIF: ABF Singapore bond index fund provided by Nikko AM.
Key Interest Rates: 2-Year U.S Treasuries, 10 Year Treasuries, Bloomberg. 1-month, 3-month SIBOR: Singapore Interbank Offered Rates provided by Association of Banks in Singapore (ABS). Oil (WTI): Global oil benchmark, Bloomberg. Gold: Gold Spot USD/Oz, Bloomberg. DXY Index: U.S. Dollar Index, Bloomberg. VIX: Expectation of volatility based on S&P index options provided by Chicago Board Options Exchange (CBOE).
The information provided herein is intended for general circulation and/or discussion purposes only. It does not account for the specific investment objectives, financial situation or needs of any individual. The information in this document is not intended to constitute research analysis or recommendation and should not be treated as such.
This does not constitute an offer or solicitation to buy/sell any financial instrument or to participate any investment strategy. No representation or warranty whatsoever (without limiting to accuracy, usefulness, adequacy, timeliness or completeness) in respect of any information (without limiting to any statement, figures, opinion, view or estimate). Syfe does not undertake an obligation to update the information or to correct any inaccuracy that may become apparent at a later time. All information presented is subject to change without notice. Syfe shall not be responsible or liable for any loss or damage whatsoever arising directly or indirectly as a result of any person acting on any information provided herein.
The information provided herein may contain projections or other forward-looking statement regarding future events or future performance of countries, assets, markets or companies. Actual events or results may differ materially. Past performance figures are not necessarily indicative of future of likely performance. Any reference to any specific company, financial product or asset class in whatever way is used for illustrative purposes only and does not constitute a recommendation. Investors should note that there are necessarily limitations and difficulties in using any graph, chart, formula or other device to determine whether or not, or if so, when to, make an investment. The contents hereof are considered proprietary information and may not be produced or disseminated in whole or in part without Syfe’s written consent.

You must be logged in to post a comment.