
Week Ahead
- US Consumer Confidence (Jan)
- FOMC Meeting
- German Q4 GDP
Thought Of The Week
Biden’s Inauguration; Return to Normality
After weeks of a tumultuous transition, Joe Biden was finally sworn in as the 46th President of United States on Wednesday. His predecessor, on the other hand, scooted off to his Mar-a-Lago estate in Florida after pardoning 73 rappers, financiers and lobbyists in his final hours. Overall, the inaugural address by Biden did not give investors any knee-jerking news but was more focused on delivering his campaign promises by “bringing America together” and to be “engaged with the world once again”.
After taking office, Biden acted swiftly to reverse some of the most controversial policies such as halting the Mexico border wall, re-joining the Paris climate accord and lifting the travel bans on Muslim-majority countries. He also pledged to vaccinate 100 million American within 100 days, which is an extremely bold move considering the operational challenges and skepticism of the public. Nonetheless, markets heaved a sigh of relief at the return of normality after 4 years of political drama and traded higher for the week. Gold held gains as investors price in a weakening dollar.
Go Big or Go Home
When it comes to an economic relief package, bigger is always better. This was the take-home message during Janet Yellen’s confirmation hearing before the Senate finance committee. She made her case for the $1.9 trillion package announced by Biden last week and believes that the “benefits will far outweigh the costs in the long run”. Other areas addressed during her speech include increasing the tax rate for the wealthy, pledging to maintain the independence of the Fed and reviewing the foreign sanctions imposed during Trump administration. Another interesting point to note, however, was Yellen’s tough stance towards China. She reiterated that there will be no immediate lifting of tariffs and will use “fully array of tools” to counter China’s “abusive economic practices”.
K-Shaped Recovery, Earnings Season Kickstarts
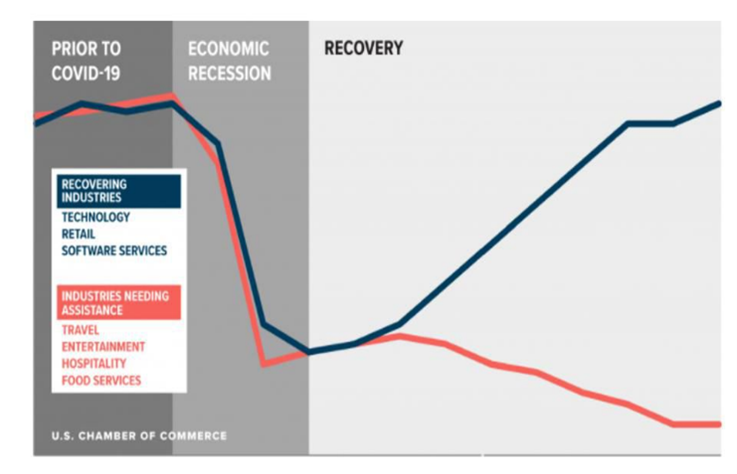
There were many shapes thrown out by market watchers when predicting the economic recovery last year: L-shaped, U-shaped, V-shaped and W-shaped, each characterized by how long the markets take to recover. Latest to join its cousins is the K-shaped recovery, which suggests that certain industries will do even better than before, while others come to a standstill.
As the earnings season goes full blast this week, we are starting to see early confirmation signs of this divergence especially from the recent full-year financial results reported by the big banks. JPMorgan Chase, Goldman Sachs and Morgan Stanley reported big jumps in their investment banking and trading units while banks with big consumer-lending arms such as Bank of America, Citigroup and Wells Fargo were hurt by the net interest income on consumer loans. Other notable earnings announcement includes Netflix, another pandemic winner, which surged more than 15% after beating forecasts and reported stronger cash generation which will reduce its debt reliance.

Chart Of The Week
A Potential K-shaped Recovery in the Making
Important Information and Disclosure
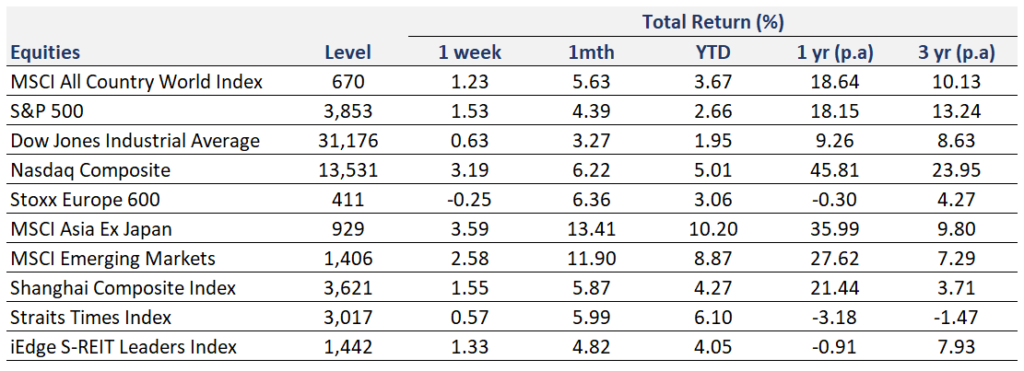
Equity Price Level and Returns: All returns represent the total return for stated period. MSCI ACWI: Global equity index provided by Morgan Stanley Capital International (MSCI). S&P 500: Market capitalization index of U.S stocks provided by Standard & Poor’s (S&P). Dow Jones: Price-weighted index of U.S stocks provided by S&P. NASDAQ: Market capitalization index of U.S stocks provided by NASDAQ. Stoxx 600: Market capitalization index of stocks listed in European region. MSCI Asia Ex Japan: Asia excluding Japan equity index provided by MSCI. MSCI EM: Emerging markets equity index provided by MSCI. SSE: Capitalization weighted index of all A-shares and B-shares listed on Shanghai Stock Exchange. STI: Market capitalization index of stocks listed on Singapore Exchange. SREITLSP: Market capitalization index of the most liquid real estate investment trusts in Singapore.
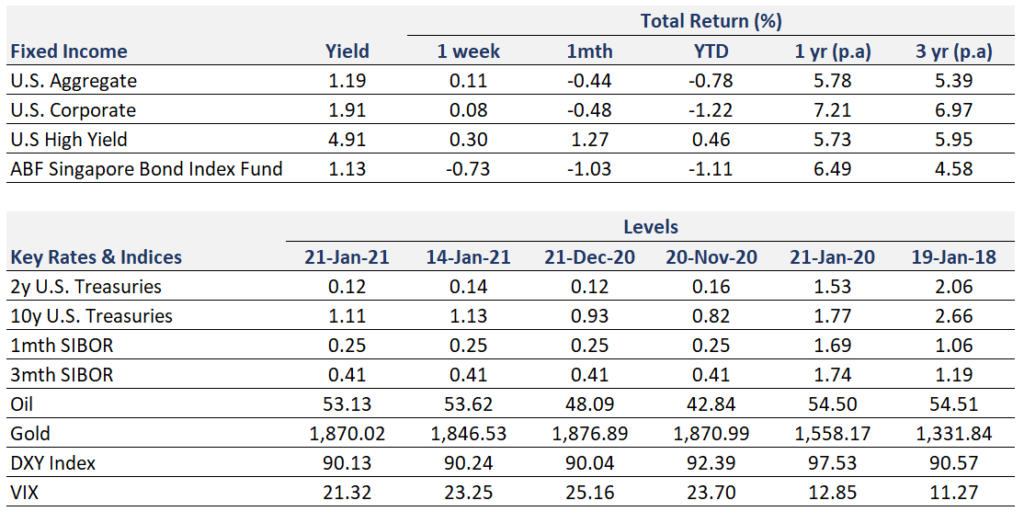
Fixed Income Yield and Returns: All returns represent total return for stated period. Global Aggregate: Global investment grade debt from both developed and emerging markets issuers. U.S. Aggregate, U.S Corporate, High Yield provided by Bloomberg Barclays Indices, ICE Data Services & WSJ. SBIF: ABF Singapore bond index fund provided by Nikko AM.
Key Interest Rates: 2-Year U.S Treasuries, 10 Year Treasuries, Bloomberg. 1-month, 3-month SIBOR: Singapore Interbank Offered Rates provided by Association of Banks in Singapore (ABS). Oil (WTI): Global oil benchmark, Bloomberg. Gold: Gold Spot USD/Oz, Bloomberg. DXY Index: U.S. Dollar Index, Bloomberg. VIX: Expectation of volatility based on S&P index options provided by Chicago Board Options Exchange (CBOE).
The information provided herein is intended for general circulation and/or discussion purposes only. It does not account for the specific investment objectives, financial situation or needs of any individual. The information in this document is not intended to constitute research analysis or recommendation and should not be treated as such.
This does not constitute an offer or solicitation to buy/sell any financial instrument or to participate any investment strategy. No representation or warranty whatsoever (without limiting to accuracy, usefulness, adequacy, timeliness or completeness) in respect of any information (without limiting to any statement, figures, opinion, view or estimate). Syfe does not undertake an obligation to update the information or to correct any inaccuracy that may become apparent at a later time. All information presented is subject to change without notice. Syfe shall not be responsible or liable for any loss or damage whatsoever arising directly or indirectly as a result of any person acting on any information provided herein.
The information provided herein may contain projections or other forward-looking statement regarding future events or future performance of countries, assets, markets or companies. Actual events or results may differ materially. Past performance figures are not necessarily indicative of future of likely performance. Any reference to any specific company, financial product or asset class in whatever way is used for illustrative purposes only and does not constitute a recommendation. Investors should note that there are necessarily limitations and difficulties in using any graph, chart, formula or other device to determine whether or not, or if so, when to, make an investment. The contents hereof are considered proprietary information and may not be produced or disseminated in whole or in part without Syfe’s written consent.

You must be logged in to post a comment.