
Week Ahead
- China Manufacturing PMI (Jan)
- ECM Monetary Policy Statement
- US Nonfarm Payrolls & Employment Rate (Jan)
Thought Of The Week
Slowdown in US Economic Rebound, FOMC Meeting
Despite US GDP advancing by 4% in the last quarter of 2020, the economy shrank by 3.5% for the full year, recording its worst contraction in decades. Dichotomy of the recovery was also observed from the slowing consumer spending as households became more cautious while other parts of the economy continued to shine. Business investment spending grew at a solid pace of 13.8%, driven by firms spending on equipment and momentum in home sales also helped to power construction. Although jobless claims came in lower than expected, employment continues to be under pressure as tighter restrictions are imposed again due to the resurgence of coronavirus, dealing another blow to the ailing labour market.
Key message from the Federal Open Market Committee (FOMC) meeting was largely aligned with market expectations. Federal Reserve Chairman Jerome Powell reiterated its pledge to hold benchmark interest rate near zero and maintain bond purchases of $120 billion per month until “substantial further progress” towards its employment and inflation goals are achieved. Markets were wild this week with CBOE Volatility Index (VIX) spiking to 62% to 37.21 on Wednesday as retail traders continued to wage their battle again hedge funds.
Junk-On, Quality-Off
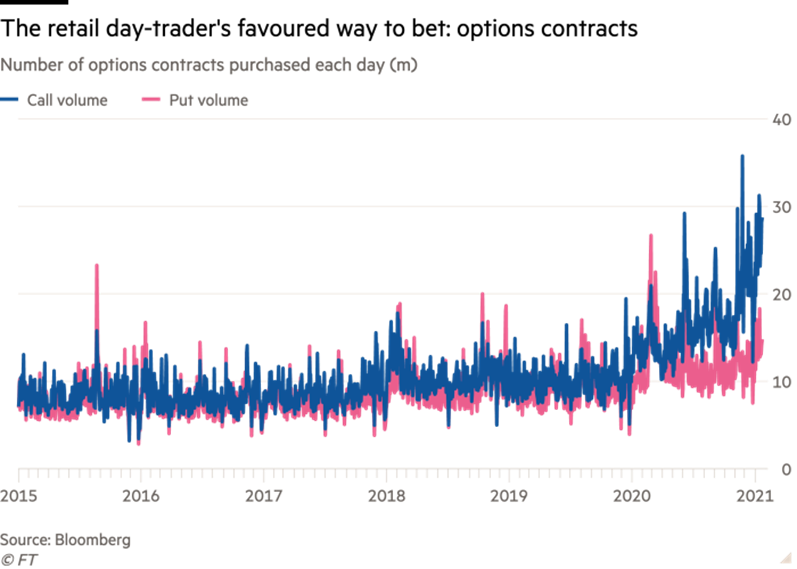
Dominating headlines this week was the dizzying rally of GameStop, which rocketed almost 1,800% since the start of 2021. This frenzy was powered by a coordinated effort by an army of day traders on Reddit, who were equipped with the access to free trading platforms and excess cash to punt on stocks. The Redditors had a clear goal to flush out hedge funds who had short positions on GameStop namely, Melvin Capital and Citron Research. By banding together to purchase deeply out-of-the-market call options, the day traders were able to drive up the price of the underlying stock up to the strike prices, forcing dealers to continually hedge their own exposures which in turn accelerates the sensitivity of the option prices to changes in the price of the underlying security. Buying call options give the holders a right to buy the stock at a pre-determined price within a certain date and magnifies gains/losses through leverage.
Trading volumes have been on a rise since last year but the smaller sizes per trade indicate that this phenomenon was led by retail investors rather than big institutions. The frenzy further escalated to numerous lawsuits against Robinhood by its users after the platform took steps to restrict buying in the high-flying stocks. Other heavily shorted stocks by hedge funds that are on the radar list include AMC Entertainment Holdings, Blackberry and Bed Bath & Beyond, which have all surged more than 100% this year.
Chart Of The Week
Options Contracts Surge As GameStop Frenzy Continues
Important Information and Disclosure
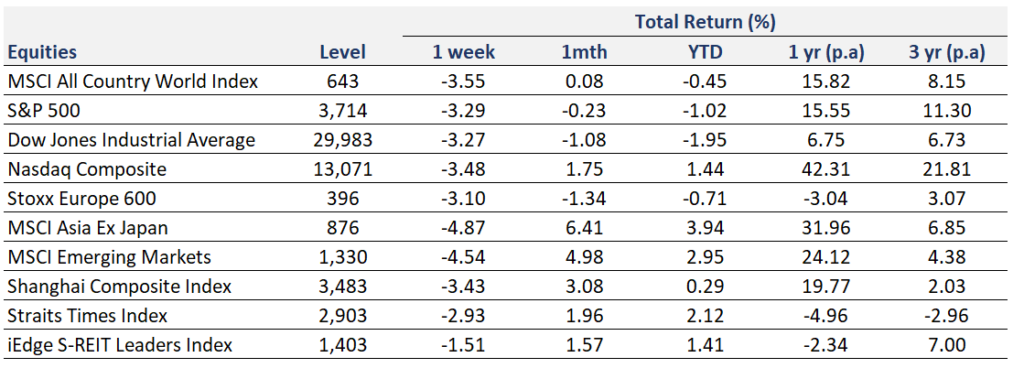
Equity Price Level and Returns: All returns represent the total return for stated period. MSCI ACWI: Global equity index provided by Morgan Stanley Capital International (MSCI). S&P 500: Market capitalization index of U.S stocks provided by Standard & Poor’s (S&P). Dow Jones: Price-weighted index of U.S stocks provided by S&P. NASDAQ: Market capitalization index of U.S stocks provided by NASDAQ. Stoxx 600: Market capitalization index of stocks listed in European region. MSCI Asia Ex Japan: Asia excluding Japan equity index provided by MSCI. MSCI EM: Emerging markets equity index provided by MSCI. SSE: Capitalization weighted index of all A-shares and B-shares listed on Shanghai Stock Exchange. STI: Market capitalization index of stocks listed on Singapore Exchange. SREITLSP: Market capitalization index of the most liquid real estate investment trusts in Singapore.
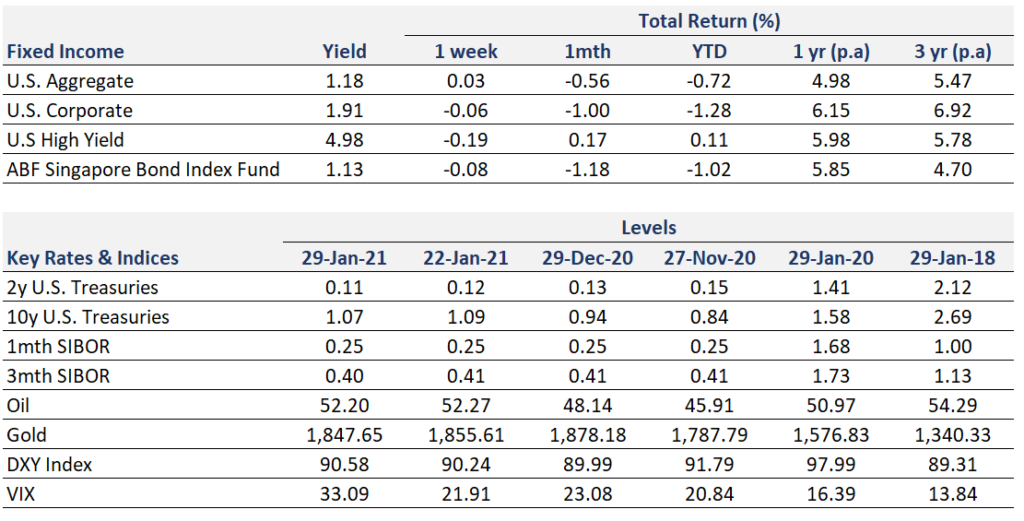
Fixed Income Yield and Returns: All returns represent total return for stated period. Global Aggregate: Global investment grade debt from both developed and emerging markets issuers. U.S. Aggregate, U.S Corporate, High Yield provided by Bloomberg Barclays Indices, ICE Data Services & WSJ. SBIF: ABF Singapore bond index fund provided by Nikko AM.
Key Interest Rates: 2-Year U.S Treasuries, 10 Year Treasuries, Bloomberg. 1-month, 3-month SIBOR: Singapore Interbank Offered Rates provided by Association of Banks in Singapore (ABS). Oil (WTI): Global oil benchmark, Bloomberg. Gold: Gold Spot USD/Oz, Bloomberg. DXY Index: U.S. Dollar Index, Bloomberg. VIX: Expectation of volatility based on S&P index options provided by Chicago Board Options Exchange (CBOE).
The information provided herein is intended for general circulation and/or discussion purposes only. It does not account for the specific investment objectives, financial situation or needs of any individual. The information in this document is not intended to constitute research analysis or recommendation and should not be treated as such.
This does not constitute an offer or solicitation to buy/sell any financial instrument or to participate any investment strategy. No representation or warranty whatsoever (without limiting to accuracy, usefulness, adequacy, timeliness or completeness) in respect of any information (without limiting to any statement, figures, opinion, view or estimate). Syfe does not undertake an obligation to update the information or to correct any inaccuracy that may become apparent at a later time. All information presented is subject to change without notice. Syfe shall not be responsible or liable for any loss or damage whatsoever arising directly or indirectly as a result of any person acting on any information provided herein.
The information provided herein may contain projections or other forward-looking statement regarding future events or future performance of countries, assets, markets or companies. Actual events or results may differ materially. Past performance figures are not necessarily indicative of future of likely performance. Any reference to any specific company, financial product or asset class in whatever way is used for illustrative purposes only and does not constitute a recommendation. Investors should note that there are necessarily limitations and difficulties in using any graph, chart, formula or other device to determine whether or not, or if so, when to, make an investment. The contents hereof are considered proprietary information and may not be produced or disseminated in whole or in part without Syfe’s written consent.

You must be logged in to post a comment.