
The Week Ahead
- U.S Core CPI (Feb)
- ECB Press Conference
Thought Of The Week
U.S Markets Whipsawed, Labour Market Improves, Senate Vote on Stimulus Bill
Economic optimism continued to keep yields elevated this week, causing concerns that companies with lofty valuations may have trouble living up to expectations if borrowing costs surge too quickly. Despite noting the recent hike in yields in his speech on Thursday, Federal Reserve Chairman Jerome Powell did not suggest any “Operational Twist” to rein in bond yields by eliminating its holding of Treasury bills and putting the money in longer-term securities since the employment figures and inflation are still far from target.
However, signs of progress can be seen in the labour market from the U.S employment report for February. Non-farm payroll increased by 379,000, beating market’s expectation of 198,000 while the unemployment rate held steady at 6.2%.
Meanwhile, Senate reached an agreement after hours of debate on Friday on an updated version of the $1.9 trillion package which will extend the $300 jobless benefit supplement till September. Senate Democrats hope that the legislation can be signed into law by next week.
Markets were mostly shedding value this week due to fear of rising interest rates and only managed to stabilise in the last trading session of the week. Tech-heavy Nasdaq 100 took a beating and erased nearly all its 2021 gains while S&P 500 and Dow are still in the positive territory for the year.
China Unveils Five-Year Economic Plan
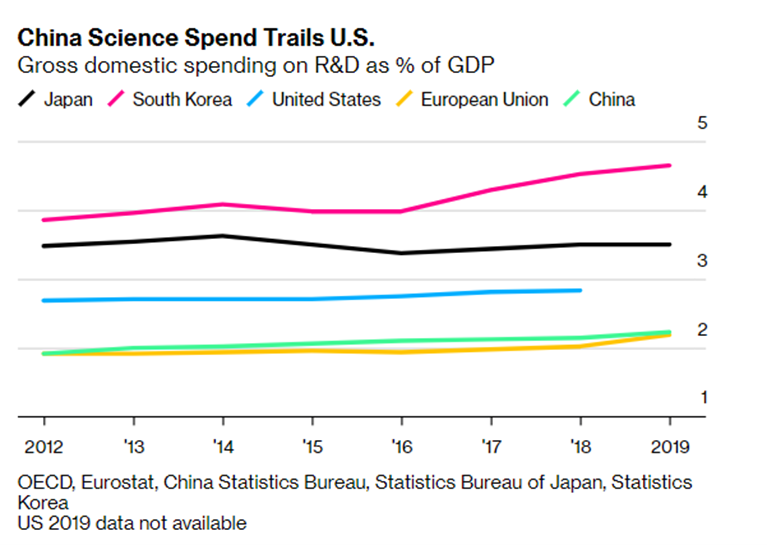
China powered its way out of the coronavirus lockdown of 2020, becoming the only major economy in the world to grow last year. This week, China’s National People’s Congress convened for its annual meeting to focus on boosting the post-Covid economy and to unveil its five-year economic plan. China’s influence on global markets has been increasingly evident – share of global output rising at the fastest pace, having the highest number of Fortune 500 companies as well as the inclusion of its sovereign debt into FTSE Russell benchmark in 2020.
As widely expected, China laid their vision to achieve self-reliance in core technologies especially in chipmaking, which are the key building blocks for artificial intelligence, 5G networking and autonomous vehicles. In its ambition to achieve chip supremacy, President Xi Jinping has also pledged to spend $1.4 trillion on developing homegrown advanced technologies to challenge TSMC, Intel and Micron. Other focus areas include increasing its defence budget by 6.8%, addressing long-term challenges such as aging population, and reforming its capital markets to be more accessible to foreign investors.
These efforts are gaining urgency as the U.S seeks to contain the rising threat from its geopolitical rival and tensions are likely to escalate further even after Trump’s administration. Guo Shuqing, one of China’s most powerful financial regulators, also warned this week about the China’s property market was still afflicted by “relatively large bubbles” and suggested lending rates would “rebound” this year. His statement triggered a pullback as markets became overly pessimistic on the liquidity. Although all the expensive sectors have fallen significantly and are threatening to destroy their uptrend, but without a massive change in fundamentals and expectations, there is no reason for them to fall further and reverse from bull to bear.
Chart Of The Week
Important Information and Disclosure
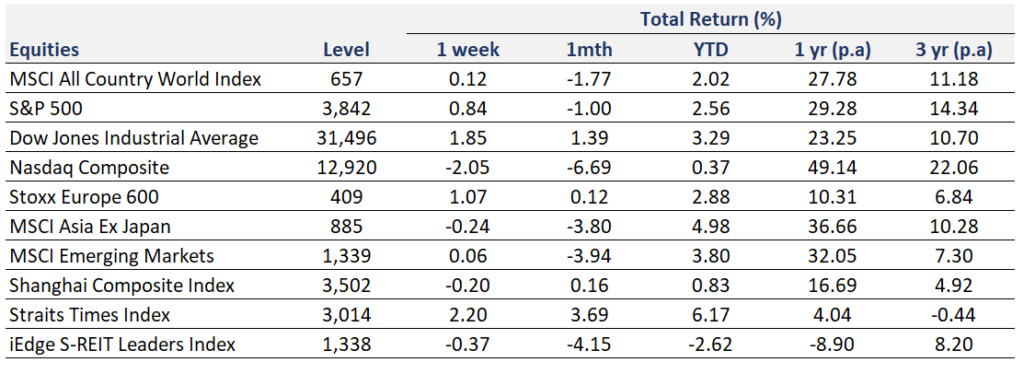
Equity Price Level and Returns: All returns represent the total return for stated period. MSCI ACWI: Global equity index provided by Morgan Stanley Capital International (MSCI). S&P 500: Market capitalization index of U.S stocks provided by Standard & Poor’s (S&P). Dow Jones: Price-weighted index of U.S stocks provided by S&P. NASDAQ: Market capitalization index of U.S stocks provided by NASDAQ. Stoxx 600: Market capitalization index of stocks listed in European region. MSCI Asia Ex Japan: Asia excluding Japan equity index provided by MSCI. MSCI EM: Emerging markets equity index provided by MSCI. SSE: Capitalization weighted index of all A-shares and B-shares listed on Shanghai Stock Exchange. STI: Market capitalization index of stocks listed on Singapore Exchange. SREITLSP: Market capitalization index of the most liquid real estate investment trusts in Singapore.
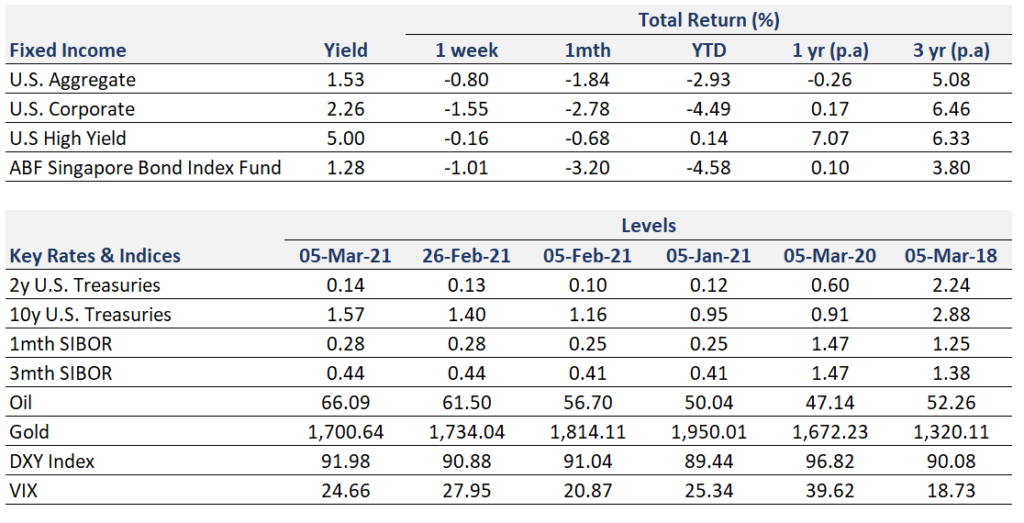
Fixed Income Yield and Returns: All returns represent total return for stated period. Global Aggregate: Global investment grade debt from both developed and emerging markets issuers. U.S. Aggregate, U.S Corporate, High Yield provided by Bloomberg Barclays Indices, ICE Data Services & WSJ. SBIF: ABF Singapore bond index fund provided by Nikko AM.
Key Interest Rates: 2-Year U.S Treasuries, 10 Year Treasuries, Bloomberg. 1-month, 3-month SIBOR: Singapore Interbank Offered Rates provided by Association of Banks in Singapore (ABS). Oil (WTI): Global oil benchmark, Bloomberg. Gold: Gold Spot USD/Oz, Bloomberg. DXY Index: U.S. Dollar Index, Bloomberg. VIX: Expectation of volatility based on S&P index options provided by Chicago Board Options Exchange (CBOE).
The information provided herein is intended for general circulation and/or discussion purposes only. It does not account for the specific investment objectives, financial situation or needs of any individual. The information in this document is not intended to constitute research analysis or recommendation and should not be treated as such.
This does not constitute an offer or solicitation to buy/sell any financial instrument or to participate any investment strategy. No representation or warranty whatsoever (without limiting to accuracy, usefulness, adequacy, timeliness or completeness) in respect of any information (without limiting to any statement, figures, opinion, view or estimate). Syfe does not undertake an obligation to update the information or to correct any inaccuracy that may become apparent at a later time. All information presented is subject to change without notice. Syfe shall not be responsible or liable for any loss or damage whatsoever arising directly or indirectly as a result of any person acting on any information provided herein.
The information provided herein may contain projections or other forward-looking statement regarding future events or future performance of countries, assets, markets or companies. Actual events or results may differ materially. Past performance figures are not necessarily indicative of future of likely performance. Any reference to any specific company, financial product or asset class in whatever way is used for illustrative purposes only and does not constitute a recommendation. Investors should note that there are necessarily limitations and difficulties in using any graph, chart, formula or other device to determine whether or not, or if so, when to, make an investment. The contents hereof are considered proprietary information and may not be produced or disseminated in whole or in part without Syfe’s written consent.

You must be logged in to post a comment.