
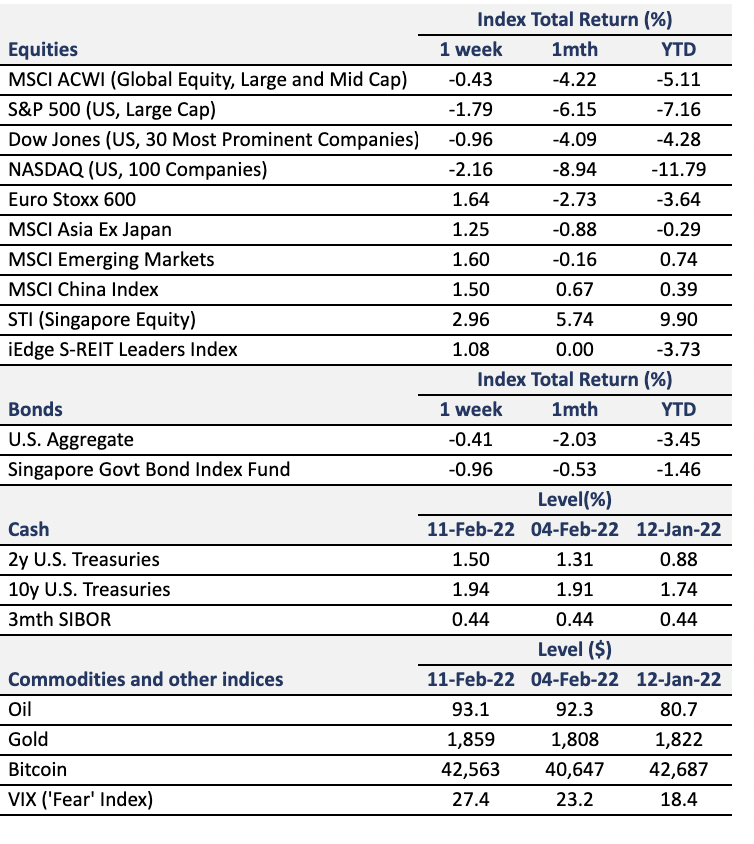
Inflation at 7.5%, US Treasury Yields Hit 2%
Stocks tumbled on Thursday and Friday after Consumer Price Index (CPI) data showed prices of goods and services climbing more than expected at 7.5% year-over-year. Investors speculate that the Federal Reserve will have to be more aggressive in rising interest rates to tamp down inflation. The possibility of a more hawkish Fed sent major equity indices down and the 10 year treasury bond yield above 2%. Bond investors are demanding more as the future coupons and principal payments are worth less with higher inflation.
The Federal Reserve is the only agency that can fight inflation. The main policy tool is interest rates. By raising interest rates, the Fed aims to slow down the economy and keep prices stable as business activity decelerates.
In the chart below, the gray areas represent periods of recessions where we see the Fed funds rate (orange line) falling, along with inflation readings (blue line). More interestingly, since the Great Financial Crisis in 2008, the key rate (Federal Funds Effective Rate) rarely exceeded inflation readings – except for a few months in 2019.
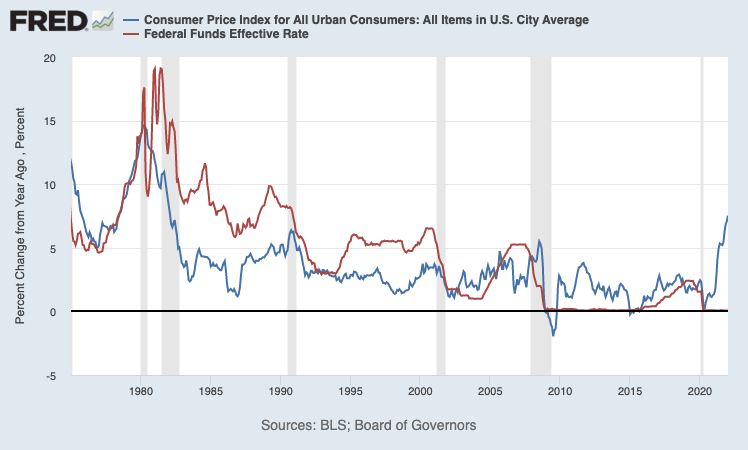
Back in the 1980s when inflation was high, the Federal Reserve raised the key rate from 10% to a high of 19% in 1981. This pushed the US economy into a recession. This time, the Federal Reserve is performing a balancing act – trying to stall rising prices while avoiding a halt in economic activity.
Business Activity still expanding in Singapore while slowing down in China
Singapore’s Purchasing Managers’ Index (PMI) dipped slightly to 50.6 in January from 50.7 in December. A PMI reading above 50 means that the sector is still expanding. This marks the 19th consecutive month of expansion in Singapore’s manufacturing sector.
China’s Caixin General Manufacturing PMI fell to 49.1 in January 2022, a 23-month low and missing market consensus of 50.4. This is the second time in 3 months where PMI has fallen below 50. Economists expected a drop due to Covid-19 flare ups and China’s zero Covid-19 policy. With the Lunar New Year, we might not see activity pick up for another month, but consumer confidence and retail sales are still robust.
Magical Quarter
Disney announced financial results for Q4 2021 last week. Visitors have spent more money at its parks through premium tickets, higher food, beverage and merchandise spending. 4Q revenue from Parks, Experiences and Products stood at 7.2bn USD, back to pre-pandemic levels in 1Q 2020.
Disney also took analysts by surprise, adding 12 million new subscribers to Disney+, twice that of consensus estimates. Since its launch in November 2019, Disney+ has gained 130m paid subscriptions, while Netflix gained 59m during the same period. This brings Disney a lot closer to their 230-260 million subscriber goal by the end 2024.
Along with Hulu and ESPN+ (also owned by Disney), total subscriber base comes in at 196 million, not too far from Netflix’s 222 million.
What to expect next week
Minutes from the FOMC January meeting will be released mid-week. UK and China January inflation data as well as fourth quarter GDP readings from the eurozone and Japan are figures to track too.
These two stocks that are popular on Syfe Trade will announce earnings next week:
Nvidia: Nvidia was one of the best performing stocks in 2021, gaining 120%. It has fallen almost 33% from its November peak. Nvidia is still the market leader in GPU and AI processors. Demand for these components and software is expected to grow despite the failed Arm deal. Nvidia continues to play a critical role in enabling technological innovation.
Palantir: Shares of PLTR are near 1 year lows. Investors are watching Palantir’s free cash flow guidance for 2022 and if growth has been accelerating in its private enterprise business. In 2021, Palantir signed on more enterprise clients onto its software platform. These commercial clients have a higher spend rate and tend to be stickier.
Important Information and Disclosure
Equity Price Level and Returns: All returns represent the total return for stated period. MSCI ACWI: Global equity index provided by Morgan Stanley Capital International (MSCI). S&P 500: Market capitalization index of U.S stocks provided by Standard & Poor’s (S&P). Dow Jones: Price-weighted index of U.S stocks provided by S&P. NASDAQ: Market capitalization index of U.S stocks provided by NASDAQ. Stoxx 600: Market capitalization index of stocks listed in European region. MSCI Asia Ex Japan: Asia excluding Japan equity index provided by MSCI. MSCI EM: Emerging markets equity index provided by MSCI. SSE: Capitalization weighted index of all A-shares and B-shares listed on Shanghai Stock Exchange. STI: Market capitalization index of stocks listed on Singapore Exchange. SREITLSP: Market capitalization index of the most liquid real estate investment trusts in Singapore.
Fixed Income Yield and Returns: All returns represent total
return for stated period. Global Aggregate: Global investment grade debt from both developed and emerging markets issuers. U.S. Aggregate, U.S Corporate, High Yield provided by Bloomberg Barclays Indices, ICE Data Services & WSJ. SBIF: ABF Singapore bond index fund provided by Nikko AM.
Key Interest Rates: 2-Year U.S Treasuries, 10 Year Treasuries, Bloomberg. 1-month, 3-month SIBOR: Singapore Interbank Offered Rates provided by Association of Banks in Singapore (ABS). Oil (WTI): Global oil benchmark, Bloomberg. Gold: Gold Spot USD/Oz, Bloomberg. DXY Index: U.S. Dollar Index, Bloomberg. VIX: Expectation of volatility based on S&P index options provided by Chicago Board Options Exchange (CBOE).
The information provided herein is intended for general circulation and/or discussion purposes only. It does not account for the specific investment objectives, financial situation or needs of any individual. The information in this document is not intended to constitute research analysis or recommendation and should not be treated as such.
This does not constitute an offer or solicitation to buy/sell any financial instrument or to participate any investment strategy. No representation or warranty whatsoever (without limiting to accuracy, usefulness, adequacy, timeliness or completeness) in respect of any information (without limiting to any statement, figures, opinion, view or estimate). Syfe does not undertake an obligation to update the information or to correct any inaccuracy that may become apparent at a later time. All information presented is subject to change without notice. Syfe shall not be responsible or liable for any loss or damage whatsoever arising directly or indirectly as a result of any person acting on any information provided herein.
The information provided herein may contain projections or other forward-looking statement regarding future events or future performance of countries, assets, markets or companies. Actual events or results may differ materially. Past performance figures are not necessarily indicative of future of likely performance. Any reference to any specific company, financial product or asset class in whatever way is used for illustrative purposes only and does not constitute a recommendation. Investors should note that there are necessarily limitations and difficulties in using any graph, chart, formula or other device to determine whether or not, or if so, when to, make an investment. The contents hereof are considered proprietary information and may not be produced or disseminated in whole or in part without Syfe’s written consent.

You must be logged in to post a comment.