
Earnings Highlights
According to research from FactSet, companies that make up the S&P 500 are likely to report the fifth consecutive quarter of positive earnings growth. Over the past 10 years, actual earnings reported by S&P 500 companies have exceeded estimated earnings by 6.5% on average. When earnings are growing, the stock of a company becomes more valuable.
With the rise in prices, the expected net profit margin for companies in the S&P is expected to decline slightly to 12.1%, still above the five-year average of 11.2%. At the sector level, four sectors are expected to have a higher profit margin (Energy, Utilities, Materials and Industrials). Companies in these sectors are more likely to be able to pass on price increases to their consumers without seeing a significant drop in demand. On the other hand, Financials are expected to see the largest decline in earnings as profits have fallen with a slowdown in the more lucrative parts of the business (investment banking and capital markets activity), a pullback in home lending and higher personnel costs. This is partially due to base effects too – coming off of a strong quarter previously and in the same time last year. As interest rates rise, banks stand to benefit as the margin between what they pay customers for deposits and what they charge for loans widen.
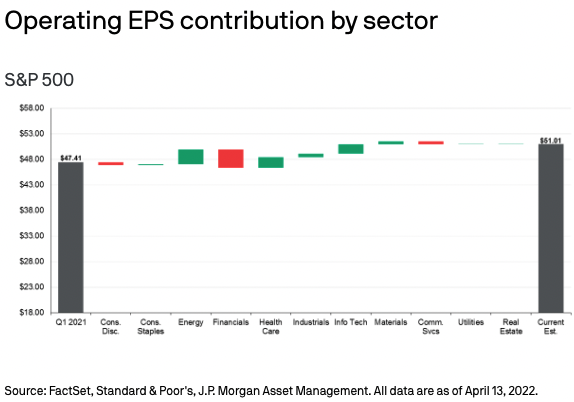
Interestingly, analysts believe that net profit margin will trend higher for the rest of the year as compared to Q1, possibly due to inflation falling and robust consumption to remain on trend.
We covered key market moves here.
A New High
Inflation hit 8.5% in March, the highest since the 1980s. This was not unexpected as food costs and fuel prices jumped to record highs with Russia’s invasion of Ukraine coupled with already tight supply. However, if food and energy (the more volatile components) were stripped out, the pace of price increases decelerated slightly.
There may be some indications that inflation has peaked. Gasoline prices in the US have declined slightly more recently and sales for used cars (a big contributor) abated. The Manheim Used Vehicle Value Index has fallen for a second month after peaking in January 2022. However, prices may remain elevated for some time as supplies of new and used cars are constrained in the short term.
Americans’ confidence in the economy has fallen as price increases have outpaced wage inflation. Fears over stagflation linger even though economic data points are still flashing green or in some cases amber – labor market (green), mortgage application rates (amber), household and company balance sheets (green).
We have seen the yield curve invert earlier this month, adding to these fears. Many investors would be aware that every recession of the past 60 years has been preceded by an inverted yield curve. However, not every curve inversion has correctly signaled a recession – there were false positives in the mid 60s and in 2019, where the recession that followed was triggered by a global pandemic.
However, according to Campbell Harvey, an economist who studies the relationship between the yield curve and whether it is a leading indicator for a recession, yield curve inversion has to happen for at least a calendar quarter before it can be regarded as a signal for impending recession. Also, since the Global Financial Crisis, due to the Fed’s involvement in the US Treasury market and subsequent distortions to the yield curve, yield curve inversion may not be as reliable a predictor for the next recession.
China: PBoC Helps
PBoC, China’s central bank, cut the bank reserve requirement ratio (RRR) last week, loosening monetary policy to boost the economy. Chinese stocks reacted positively to the news. Premier Li also encouraged banks to lend to small and medium enterprises. Heightened macroeconomic risks from Russia’s invasion of Ukraine , domestic slowdown and a weak property market in China has led to lower growth expectations.
On the fiscal front, local governments have expedited infrastructure spending while the finance ministry has promised tax cuts, in a joint effort to boost consumption. As lockdowns continue, it will prove more difficult to achieve the economic growth target of 5.5% without even more aggressive stimulus.
What’s Ahead
We are starting to get more Q1 2022 earnings from the large-caps. Next week, we’ll hear from Tesla, Netflix, Snapchat, consumer companies Procter & Gamble and LVMH, and oil field services firms such as Baker Hughes, Halliburton and Schlumberger.
Where could markets go from here?
Recent recovery in the equity markets came as investors realized that the worst-case scenario for the economy has not materialized. Companies and households are entering this next stage of the economic cycle with good fundamentals and strong balance sheets. We do see a divergence in expectations from bond and equity investors: where the former appears less optimistic.
While growth may be held back by persistent inflationary pressures in the short term, investors can take a diversified approach: seeking balance between value and growth, and US and international.
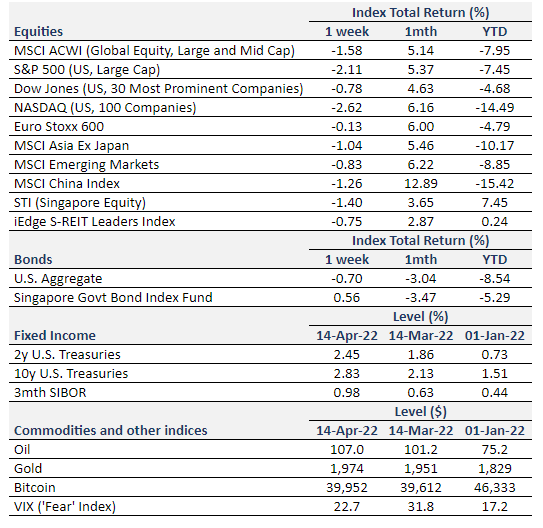
Equity Price Level and Returns: All returns represent the total return for stated period. MSCI ACWI: Global equity index provided by Morgan Stanley Capital International (MSCI). S&P 500: Market capitalization index of U.S stocks provided by Standard & Poor’s (S&P). Dow Jones: Price-weighted index of U.S stocks provided by S&P. NASDAQ: Market capitalization index of U.S stocks provided by NASDAQ. Euro Stoxx 600: Market capitalization index of stocks listed in European region. MSCI Asia Ex Japan: Asia excluding Japan equity index provided by MSCI. MSCI EM: Emerging markets equity index provided by MSCI. SSE: Capitalization weighted index of all A-shares and B-shares listed on Shanghai Stock Exchange. STI: Market capitalization index of stocks listed on Singapore Exchange. SREITLSP: Market capitalization index of the most liquid real estate investment trusts in Singapore.
Fixed Income Yield and Returns: All returns represent total return for stated period. U.S. Aggregate and SBIF from Bloomberg.
Key Interest Rates: 2-Year U.S Treasuries, 10 Year Treasuries, Bloomberg. 3-month SIBOR: Singapore Interbank Offered Rates provided by Association of Banks in Singapore (ABS). Oil (WTI): Global oil benchmark, Bloomberg. Gold: Gold Spot USD/Oz, Bloomberg. Bitcoin/USD, Bloomberg. VIX: Expectation of volatility based on S&P index options provided by Chicago Board Options Exchange (CBOE).
The information provided herein is intended for general circulation and/or discussion purposes only. It does not account for the specific investment objectives, financial situation or needs of any individual. The information in this document is not intended to constitute research analysis or recommendation and should not be treated as such.
This does not constitute an offer or solicitation to buy/sell any financial instrument or to participate any investment strategy. No representation or warranty whatsoever (without limiting to accuracy, usefulness, adequacy, timeliness or completeness) in respect of any information (without limiting to any statement, figures, opinion, view or estimate). Syfe does not undertake an obligation to update the information or to correct any inaccuracy that may become apparent at a later time. All information presented is subject to change without notice. Syfe shall not be responsible or liable for any loss or damage whatsoever arising directly or indirectly as a result of any person acting on any information provided herein.
The information provided herein may contain projections or other forward-looking statement regarding future events or future performance of countries, assets, markets or companies. Actual events or results may differ materially. Past performance figures are not necessarily indicative of future of likely performance. Any reference to any specific company, financial product or asset class in whatever way is used for illustrative purposes only and does not constitute a recommendation. Investors should note that there are necessarily limitations and difficulties in using any graph, chart, formula or other device to determine whether or not, or if so, when to, make an investment. The contents hereof are considered proprietary information and may not be produced or disseminated in whole or in part without Syfe’s written consent.

You must be logged in to post a comment.