
Chinese equities: what a ride
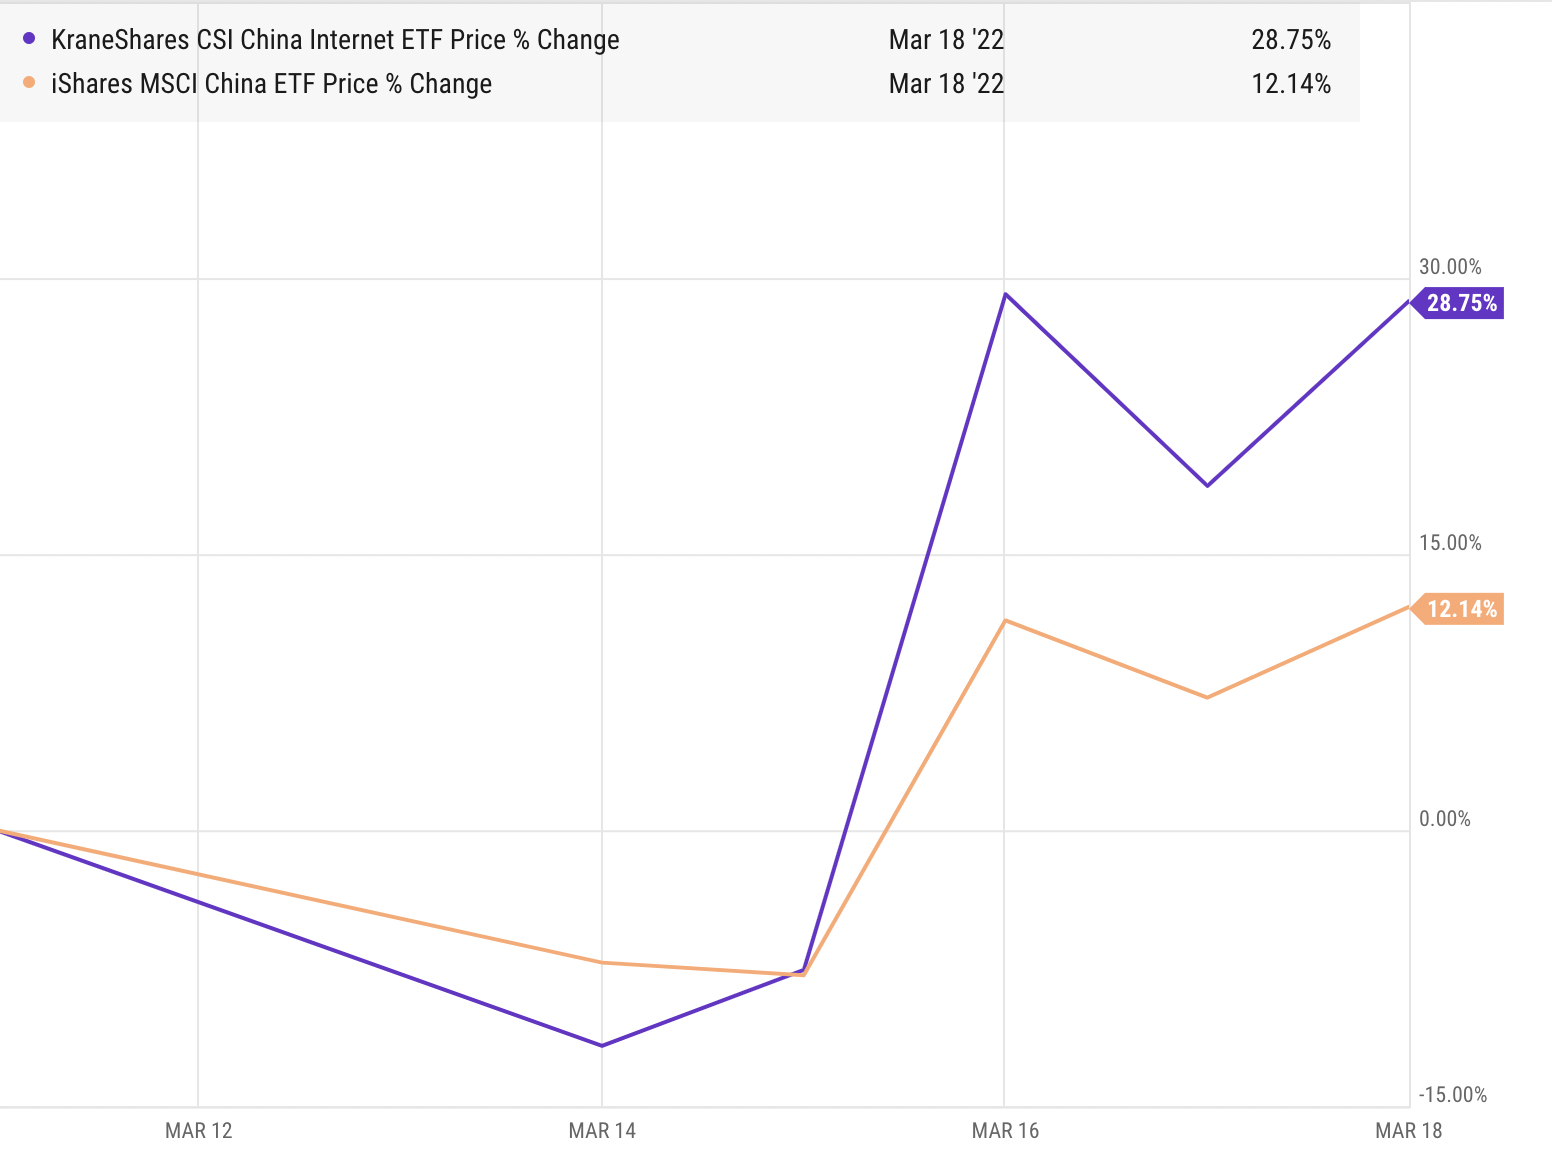
Earlier in the week on Monday, Chinese tech stocks were down over 11% after five companies were added to the provisional list for Holding Foreign Companies Accountable Act (HFCAA). However, China’s Vice Premier Liu He’s speech at the State Council’s Financial Stability and Development Committee on Wednesday alleviated delisting fears and boosted sentiment by indicating government support for the beleaguered Chinese equity market. His commitment to support Chinese listed overseas sent stocks soaring, with the CSI Overseas China Internet Index up nearly 40%.
We see the risk of delisting to be very limited for iShares MSCI China ETF (MCHI) and KraneShares CSI China Internet ETF (KWEB), two ETFs held in Syfe Core portfolios. KWEB already has less than 34% of its holdings in foreign-listed ADRs and this is expected to go to zero by the end of the year.
First Rate Hike since 2018
The FOMC delivered its first hike of 0.25% since 2018, in a move that was widely expected and priced in. Based on the dot plot released on Wednesday (EST) we can expect up to six more hikes for the year, bringing it to a total of 7 hikes. This is certainly more hawkish as compared to the last dot plot from December 2021, where voting members projected 3 hikes for 2022.
How Did Markets React?
US stocks sold off right after the release of the statement and dot plot, but later regained to end the session 2.2% higher after Chair Powell assured investors during the press conference that “the economy no longer needs – or wants – this highly accommodative stance”. Stocks continued on this path in the next session, possibly signaling that even though the Fed was slightly behind the curve, it will not slam the brakes hard to curb inflation at the expense of growth.
Bond markets reacted differently, with the yields on the front end of the curve moving higher and longer term yields coming down – also known as a bear flattening move. The spread between the two and ten year treasuries narrowed further, down to 20bps, bringing the curve closer to a possible inversion. Many investors would be aware that every recession of the past 60 years has been preceded by an inverted yield curve. However, not every curve inversion has correctly signaled a recession – there were false positives in the mid 60s and in 2019, where the recession that followed was triggered by a global pandemic.
What does this mean for consumers and businesses?
Ostensibly, the cost of borrowing – from credit cards, student loans, car loans, mortgages – will increase. By raising the fed funds rate (the rate banks charge each other for overnight loans), the Fed seeks to set off a domino effect causing the demand of goods and services to slow down and consequently inflation to abate.
The impact or pain of rate hikes to the consumer will most likely become more evident several hikes in, but with supply shocks already increasing the cost of goods and services, household budgets are already taking a hit. This showed up in the February retail sales data that slowed to 0.3% vs. 4.9% in January.
An increase in fed funds rate usually means banks have to pay more interest on deposits, but typically this does not happen right away as the largest banks already have plenty of deposits and liquidity. Money market funds that hold short term securities tend to react more quickly to changes in the fed funds rate.
False Starts at Peace Talks
After four days of peace talks that yielded little, oil was back up to above $100/barrel. Russia avoided a default on its USD-denominated bonds after making an interest payment of $117m USD. It was uncertain that Russia would be able to make the payment due to the financial sanctions and its limited pool of foreign reserves. Russia has been excluded from indices and funds that track those indices due to the recent capital controls imposed by the government.
Earnings Highlights
We covered key market moves here.
What’s Ahead
All of S&P 500 companies have reported Q4 20221 earnings. 77% beat EPS (earnings per share estimates while 69% beat revenue estimates.
Evergrande has a bond maturing next week; it is currently trading at about 10-11cents on the dollar, showing that investors are currently very skeptical about being paid back in full.
Adobe, which makes the most in-demand creative software in the market, is set to report earnings next week. ADBE has fallen from a high of almost $690 to $450 now. Adobe has cornered the market for graphic design and creative software applications. Use of the Adobe-created pdf file format is expected to increase as it can be opened across several operating systems and devices. However, there are many free PDF readers, limiting Adobe’s ability to upsell to its existing users.
Where could markets go from here?
Wars cause tremendous humanitarian cost. Historically, geopolitical conflict tends to have a relatively short-lived effect on markets. However, war on the border of Europe is unprecedented. Investors can take this moment to check that portfolios have sufficient diversification: across asset classes, sectors and countries. Exposure to commodities as a shorter term hedge could be useful too.
The rise in commodity prices and potential supply shocks as a response to the war have ignited fears of stagflation, which last happened more than 40 years ago in a vastly different world. To Chair Powell, “the probability of a recession within the next year is not particularly elevated” as demand is strong, “household and business balance sheets are strong” signaling an economy that is still able to “flourish in the face of less accommodative policy”.
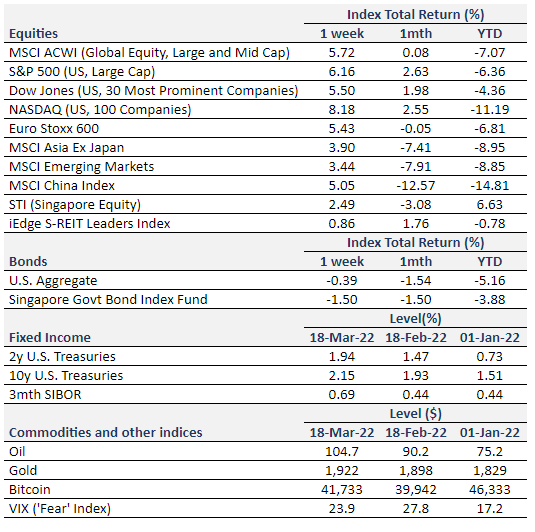
Equity Price Level and Returns: All returns represent the total return for stated period. MSCI ACWI: Global equity index provided by Morgan Stanley Capital International (MSCI). S&P 500: Market capitalization index of U.S stocks provided by Standard & Poor’s (S&P). Dow Jones: Price-weighted index of U.S stocks provided by S&P. NASDAQ: Market capitalization index of U.S stocks provided by NASDAQ. Euro Stoxx 600: Market capitalization index of stocks listed in European region. MSCI Asia Ex Japan: Asia excluding Japan equity index provided by MSCI. MSCI EM: Emerging markets equity index provided by MSCI. SSE: Capitalization weighted index of all A-shares and B-shares listed on Shanghai Stock Exchange. STI: Market capitalization index of stocks listed on Singapore Exchange. SREITLSP: Market capitalization index of the most liquid real estate investment trusts in Singapore.
Fixed Income Yield and Returns: All returns represent total return for stated period. U.S. Aggregate and SBIF from Bloomberg.
Key Interest Rates: 2-Year U.S Treasuries, 10 Year Treasuries, Bloomberg. 3-month SIBOR: Singapore Interbank Offered Rates provided by Association of Banks in Singapore (ABS). Oil (WTI): Global oil benchmark, Bloomberg. Gold: Gold Spot USD/Oz, Bloomberg. Bitcoin/USD, Bloomberg. VIX: Expectation of volatility based on S&P index options provided by Chicago Board Options Exchange (CBOE).
The information provided herein is intended for general circulation and/or discussion purposes only. It does not account for the specific investment objectives, financial situation or needs of any individual. The information in this document is not intended to constitute research analysis or recommendation and should not be treated as such.
This does not constitute an offer or solicitation to buy/sell any financial instrument or to participate any investment strategy. No representation or warranty whatsoever (without limiting to accuracy, usefulness, adequacy, timeliness or completeness) in respect of any information (without limiting to any statement, figures, opinion, view or estimate). Syfe does not undertake an obligation to update the information or to correct any inaccuracy that may become apparent at a later time. All information presented is subject to change without notice. Syfe shall not be responsible or liable for any loss or damage whatsoever arising directly or indirectly as a result of any person acting on any information provided herein.
The information provided herein may contain projections or other forward-looking statement regarding future events or future performance of countries, assets, markets or companies. Actual events or results may differ materially. Past performance figures are not necessarily indicative of future of likely performance. Any reference to any specific company, financial product or asset class in whatever way is used for illustrative purposes only and does not constitute a recommendation. Investors should note that there are necessarily limitations and difficulties in using any graph, chart, formula or other device to determine whether or not, or if so, when to, make an investment. The contents hereof are considered proprietary information and may not be produced or disseminated in whole or in part without Syfe’s written consent.

You must be logged in to post a comment.