
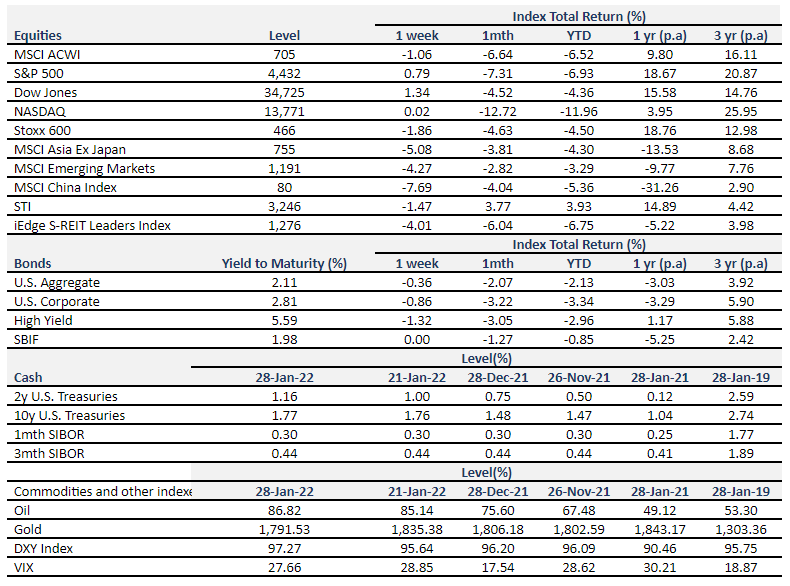
The week in review
Stocks
The US stock market had a rough week, with the Nasdaq falling more than 15% from peak and S&P500 falling 10% from peak.
The indices ended the week roughly where they started, with S&P500 up 0.79%, and Nasdaq up 0.02%.
Read more:
Worried About Market Volatility? Here’s Why You Shouldn’t Panic
Nasdaq Correction: What To Do When The Market Goes Down
January 2022 FOMC Meeting: 10 Things You Should Know
Bonds
The 10-year US Treasury yield hovered around 1.8% after hitting a two year high of 1.9% the week before.
Oil
Brent crude prices hit a fresh 7-year high of more than $90/bl on supply constraints relative to demand and geopolitical tensions in Russia/Ukraine.
Bitcoin
During the week, Bitcoin fluctuated around 36,000 USD, reaching a low of 33,000 USD on Monday.
Highlights
IMF cuts global growth estimates, but what has changed?
Global growth is expected to moderate from 5.9% in 2021 to 4.4% in 2022, 0.5% lower than the previous estimate for 2022 in the October 2021 World Economic Outlook by the IMF. The markdown is largely attributable to two countries: the US – the delay and reduction in scope of Biden’s Build Back Better fiscal policy package, early withdrawal of monetary accommodation and continued supply chain disruptions and China – ongoing retrenchment of China’s real estate sector and slower-than-expected recovery of private consumption. In the same week, we saw that the US economy grew by 5.7% in 2021, the largest annual increase since 1984. This was largely driven by strong policy support throughout the year and inventory rebuilding efforts later in the year.
Fundamentally, despite the turmoil in the financial markets in the last two weeks, little has changed. MAS contends that “Global economic prospects remain largely intact. The Omicron variant that emerged in late 2021 may temporarily dampen specific clusters of activity, but is unlikely to derail the broader ongoing economic recovery. Accordingly, global GDP is still forecast to expand at an above-trend pace for a second consecutive year in 2022, even as uncertainties remain.” In 2021, we saw tremendous earnings growth (45% y-o-y), way above the long term 10 year average of around 5%. This blockbuster figure stems from both base effects (weak earnings in 2020) and higher earnings in 2021 across all sectors. What might we expect to see in 2022?
Corporate earnings were up in Q4, but did that help?
Microsoft was one the first to report earnings on Tuesday for Q4 2021. Despite beating expectations and growing revenue by 20% (as compared to the same period last year), Microsoft’s shares dropped 5% in after-hours trading before rebounding and ending the week 5% higher. Microsoft’s cloud offerings to commercial customers (Office 365 subscriptions and Azure, its cloud computing platform) led the way, reflecting how customers across industries are moving their businesses online. This is not a trend that will reverse, even after the pandemic ends.
On Wednesday, Tesla shared that sales soared in all markets, especially in Europe and China, and its profit rose more than 6x last year. Deliveries rose 87%, to almost 1 million cars, a figure that seemed impossible not too long ago. The fact that Tesla has managed to achieve this during a global chip shortage is quite remarkable. Despite beating revenue estimates, and closing the year with a strong 4th quarter, its share price fell due to delays in expanding its product lineup and worries about supply chain disruptions.
Apple weathered supply chain issues too, but still managed to beat Wall Street analysts’ estimates with record results. Tim Cook was more optimistic; he expected supply chain problems in Q1 2022 to be less severe than they were in Q4 2021. Apple reiterated its plans to continue funding dividend growth and share buybacks through its cash reserves of almost 200bn USD. Investors welcomed this by sending Apple’s stock price 5% higher post Q4 results.
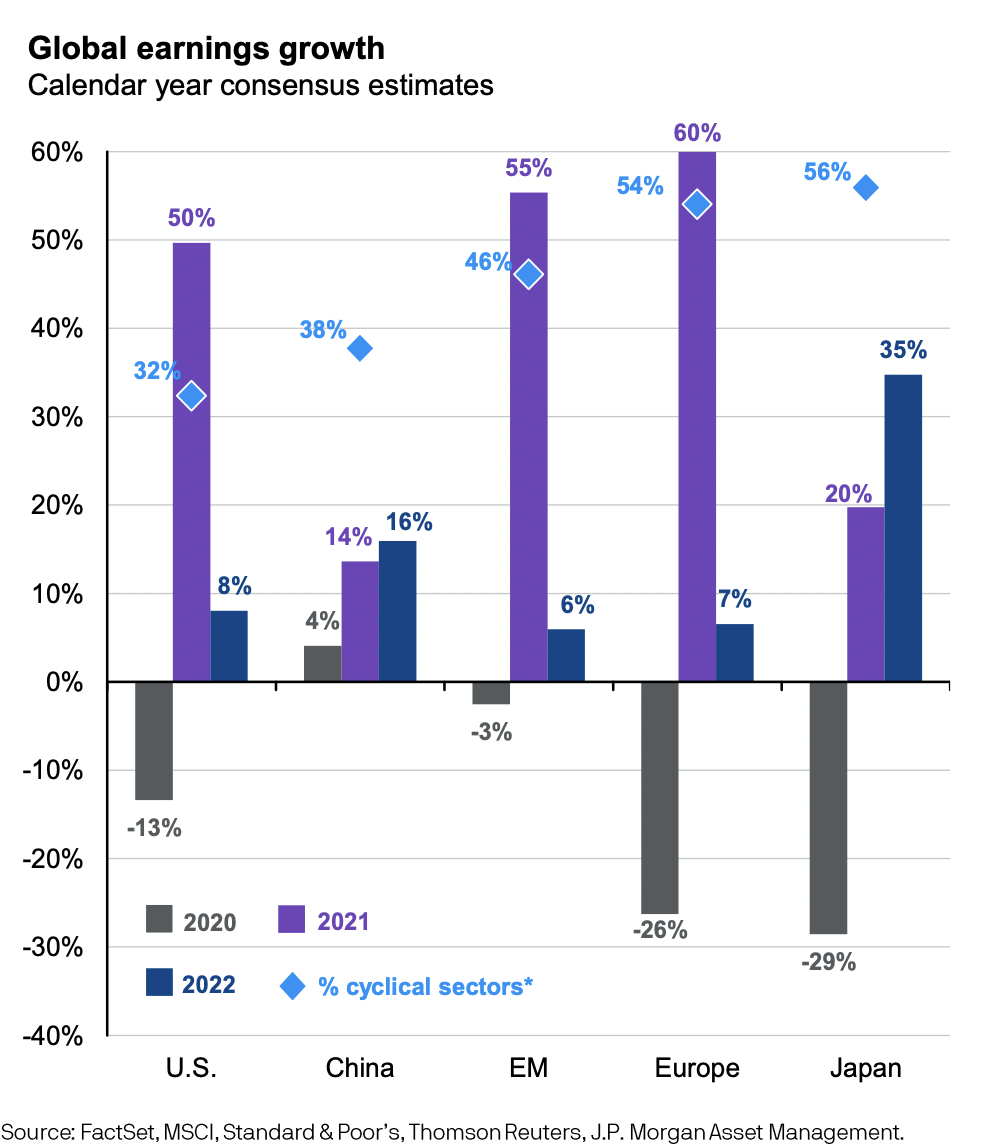
What does this mean for 2022?
Earnings growth is still a dominant driver of equity returns. Looking at the three companies above, market participants gauged that Tesla’s earnings growth in 2022 and possibly beyond would be more range bound in comparison.
According to the chart below from JP Morgan Asset Management, US equity earnings are expected to grow at about 8% while Chinese equity earnings growth is expected to be double that at 16% in 2022. With the recent fall in US equity prices, this could be a good time for investors to ensure that their portfolios are diversified across industries and geographies. In 2022, as in 2021, we would still expect earnings growth to drive equity returns.
MAS Is One Step Ahead
MAS tightened monetary policy to address inflation concerns on Tuesday, in a surprise inter-meeting move. Singapore’s central bank does not utilize short term rates in the way that the Federal Reserve does. Instead, MAS manages monetary policy through our exchange rate, adjusting 3 aspects of the S$NEER policy band – the width, the slope, and the midpoint. MAS announced its intention to “raise slightly” the rate of appreciation of the SGD nominal effective exchange rate (S$NEER) policy band to “ensur[e] medium-term price stability”. This move will cause the SGD to appreciate against a basket of currencies and limit the impact of imported inflation.
This move also puts Singapore slightly ahead of the curve as compared to the United States, where the Federal Reserve is poised to raise the fed funds rate in March 2022.
This move does not directly affect sectors such as REITs that are seen as more yield sensitive. In fact, in the last round of rising interest rates that started in 2017, Singapore REITs actively refinanced their debt and maintained high debt hedge ratios (>70% in 2017), thereby mitigating the impact of higher borrowing costs in the near term.
What to expect next week
Key indicators the Federal Reserve is watching to gauge the state of the labor market will be released next week: Non farm payrolls added in January, labor participation rate, quit rates, growth in average hourly wages. Next week, we will hear from Google, Meta, Amazon, Exxon, Alibaba, General Motors, Advanced Micro Devices, and pharmaceutical companies.
Important Information and Disclosure
Equity Price Level and Returns: All returns represent the total return for stated period. MSCI ACWI: Global equity index provided by Morgan Stanley Capital International (MSCI). S&P 500: Market capitalization index of U.S stocks provided by Standard & Poor’s (S&P). Dow Jones: Price-weighted index of U.S stocks provided by S&P. NASDAQ: Market capitalization index of U.S stocks provided by NASDAQ. Stoxx 600: Market capitalization index of stocks listed in European region. MSCI Asia Ex Japan: Asia excluding Japan equity index provided by MSCI. MSCI EM: Emerging markets equity index provided by MSCI. SSE: Capitalization weighted index of all A-shares and B-shares listed on Shanghai Stock Exchange. STI: Market capitalization index of stocks listed on Singapore Exchange. SREITLSP: Market capitalization index of the most liquid real estate investment trusts in Singapore.
Fixed Income Yield and Returns: All returns represent total
return for stated period. Global Aggregate: Global investment grade debt from both developed and emerging markets issuers. U.S. Aggregate, U.S Corporate, High Yield provided by Bloomberg Barclays Indices, ICE Data Services & WSJ. SBIF: ABF Singapore bond index fund provided by Nikko AM.
Key Interest Rates: 2-Year U.S Treasuries, 10 Year Treasuries, Bloomberg. 1-month, 3-month SIBOR: Singapore Interbank Offered Rates provided by Association of Banks in Singapore (ABS). Oil (WTI): Global oil benchmark, Bloomberg. Gold: Gold Spot USD/Oz, Bloomberg. DXY Index: U.S. Dollar Index, Bloomberg. VIX: Expectation of volatility based on S&P index options provided by Chicago Board Options Exchange (CBOE).
The information provided herein is intended for general circulation and/or discussion purposes only. It does not account for the specific investment objectives, financial situation or needs of any individual. The information in this document is not intended to constitute research analysis or recommendation and should not be treated as such.
This does not constitute an offer or solicitation to buy/sell any financial instrument or to participate any investment strategy. No representation or warranty whatsoever (without limiting to accuracy, usefulness, adequacy, timeliness or completeness) in respect of any information (without limiting to any statement, figures, opinion, view or estimate). Syfe does not undertake an obligation to update the information or to correct any inaccuracy that may become apparent at a later time. All information presented is subject to change without notice. Syfe shall not be responsible or liable for any loss or damage whatsoever arising directly or indirectly as a result of any person acting on any information provided herein.
The information provided herein may contain projections or other forward-looking statement regarding future events or future performance of countries, assets, markets or companies. Actual events or results may differ materially. Past performance figures are not necessarily indicative of future of likely performance. Any reference to any specific company, financial product or asset class in whatever way is used for illustrative purposes only and does not constitute a recommendation. Investors should note that there are necessarily limitations and difficulties in using any graph, chart, formula or other device to determine whether or not, or if so, when to, make an investment. The contents hereof are considered proprietary information and may not be produced or disseminated in whole or in part without Syfe’s written consent.

You must be logged in to post a comment.