
Economic Fears
The S&P 500 had its worst monthly decline since March 2020 as economic fears increased recently – particularly as the FOMC is set to meet next week and possibly arrive at a 50bps hike of the Fed funds rate. Back in January and February, it was mostly unfathomable that a double hike was in the cards. In April, and as we wrote last week, basing off of speeches and public comments from Fed officials, the rhetoric has shifted to how “it is appropriate” in Powell’s view “to be moving a little more quickly”.
A severe lockdown in China that has dragged into its second month for some and Russia’s invasion of Ukraine added to global supply disruptions. Earnings from some large technology companies were better than expected and the labor market and data on consumption continue to demonstrate resilience.
We covered key market moves here.
All Eyes on the Consumer
Consumers, the engine of the US economy, make an outsize contribution to GDP, accounting for close to two thirds of economic activity. As prices increase along with cost of borrowing, consumer sentiment has understandably softened recently.
Companies such as McDonalds, United Airlines, PepsiCo, and Starbucks have passed on rising costs while still reporting higher sales. It remains to be seen how far this can continue. For the first quarter of 2022, according to FactSet, 80% of companies that have reported so far have done better than expected, but the extent of exceeding expectations narrowed.
Global Slowdown Woes Continue
Companies like Caterpillar, Apple and Tesla cautioned that lockdowns in China were affecting their operations – we will only see the effect more clearly in Q2 2022 earnings. Consumer spending and consumer sentiment would be key aspects to watch in the next few weeks – if pent up demand from lockdowns can make up for lost time.
Interestingly as compared to Shanghai, a lockdown in Beijing poses less economic disruption. Beijing is part of the so-called Jing-Jin-Ji metropolitan area, an economic grouping that includes Hebei province and the Tianjin municipality, but with less than half the population of the Yangtze River Delta (YRD) region and making up only 8% of China’s economy as explained by Gary Ng, senior economist for Asia-Pacific at investment bank Natixis.
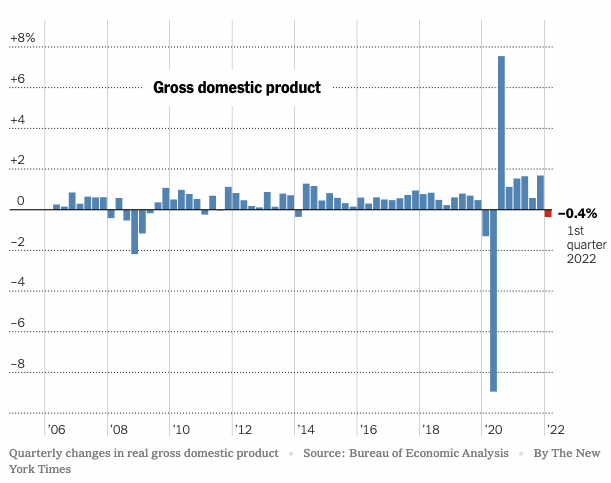
US Q1 GDP fell 1.4% – a reversal from a buoyant 1.7% in the last quarter of 2021. The decline resulted from slower inventory growth after companies stock-piled in 2021, reduced government spending as Covid-19 relief efforts wind down and a growing trade deficit (US imported more to keep up with demand). On the other hand, several indicators pointed to a recovery that was still on track – consumer spending in particular gained 0.7% in Q1 despite higher food and energy prices. However, the saving rate fell below pre-pandemic levels for the first time as consumers save less to keep up. The White House shrugged off the decline in GDP, attributing it to “technical factors” and data quirks. After stripping out the effects of inventory and trade and adjusting for inflation, Q1 GDP grew at 0.6%, indicating that a recovery is still underway.
What’s Ahead
All eyes on FOMC next week (May 3rd), and non-farm payrolls next Friday. Data from consumer companies would ones to watch next week: Starbucks, Airbnb, Booking.com. After Exxon and Chevron reported stellar figures last week, we will hear from other energy companies next week: BP, Marathon, Shell and ConocoPhilips.
Where could markets go from here?
Risks to growth have increased lately but the worst case scenario has not materialized. Companies and households are entering this next stage of the economic cycle with good fundamentals and strong balance sheets (and wide profit margins vs. historical levels for many corporations). Previously, we saw a divergence in expectations from bond and equity investors: where the former appears less optimistic but now after equity markets sold off, expectations are more aligned.
While growth may be held back by persistent inflationary pressures in the short term, investors can take a diversified approach: seeking balance between value and growth, and US and international.
Equity Price Level and Returns: All returns represent the total return for stated period. MSCI ACWI: Global equity index provided by Morgan Stanley Capital International (MSCI). S&P 500: Market capitalization index of U.S stocks provided by Standard & Poor’s (S&P). Dow Jones: Price-weighted index of U.S stocks provided by S&P. NASDAQ: Market capitalization index of U.S stocks provided by NASDAQ. Euro Stoxx 600: Market capitalization index of stocks listed in European region. MSCI Asia Ex Japan: Asia excluding Japan equity index provided by MSCI. MSCI EM: Emerging markets equity index provided by MSCI. SSE: Capitalization weighted index of all A-shares and B-shares listed on Shanghai Stock Exchange. STI: Market capitalization index of stocks listed on Singapore Exchange. SREITLSP: Market capitalization index of the most liquid real estate investment trusts in Singapore.
Fixed Income Yield and Returns: All returns represent total return for stated period. U.S. Aggregate and SBIF from Bloomberg.
Key Interest Rates: 2-Year U.S Treasuries, 10 Year Treasuries, Bloomberg. 3-month SIBOR: Singapore Interbank Offered Rates provided by Association of Banks in Singapore (ABS). Oil (WTI): Global oil benchmark, Bloomberg. Gold: Gold Spot USD/Oz, Bloomberg. Bitcoin/USD, Bloomberg. VIX: Expectation of volatility based on S&P index options provided by Chicago Board Options Exchange (CBOE).
The information provided herein is intended for general circulation and/or discussion purposes only. It does not account for the specific investment objectives, financial situation or needs of any individual. The information in this document is not intended to constitute research analysis or recommendation and should not be treated as such.
This does not constitute an offer or solicitation to buy/sell any financial instrument or to participate any investment strategy. No representation or warranty whatsoever (without limiting to accuracy, usefulness, adequacy, timeliness or completeness) in respect of any information (without limiting to any statement, figures, opinion, view or estimate). Syfe does not undertake an obligation to update the information or to correct any inaccuracy that may become apparent at a later time. All information presented is subject to change without notice. Syfe shall not be responsible or liable for any loss or damage whatsoever arising directly or indirectly as a result of any person acting on any information provided herein.
The information provided herein may contain projections or other forward-looking statement regarding future events or future performance of countries, assets, markets or companies. Actual events or results may differ materially. Past performance figures are not necessarily indicative of future of likely performance. Any reference to any specific company, financial product or asset class in whatever way is used for illustrative purposes only and does not constitute a recommendation. Investors should note that there are necessarily limitations and difficulties in using any graph, chart, formula or other device to determine whether or not, or if so, when to, make an investment. The contents hereof are considered proprietary information and may not be produced or disseminated in whole or in part without Syfe’s written consent.
