
The week in review
Stocks
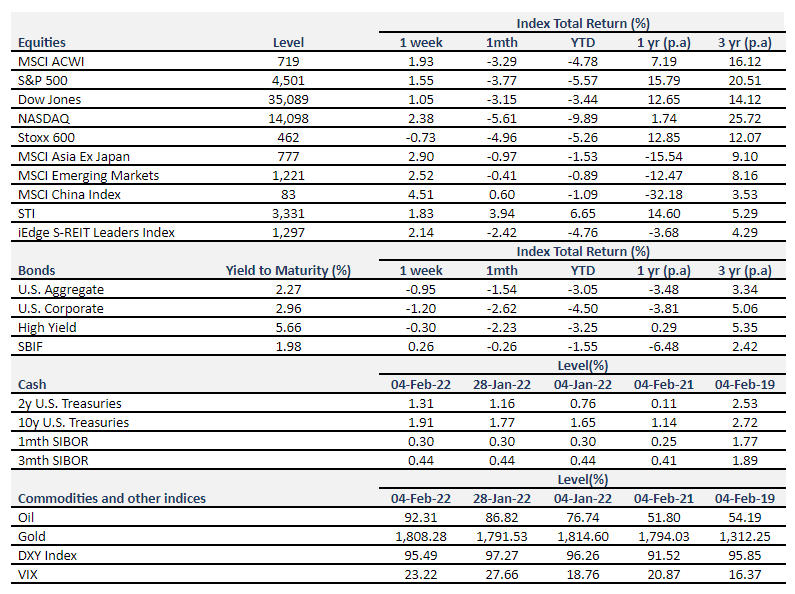
S&P500 is up 1.6% for the week while Nasdaq 100 is up 2.4% buoyed by earnings from Alphabet, Amazon, and Exxon.
Bonds
The US 10Y Treasury yield hit a high of 1.93% while the 2Y yield rose by 15bps, making the yield curve flatter after Non-Farm Payroll (NFP) figures for January were released on Friday.
Oil
Oil hit another high of $93/bbl. Winter storms are fuelling supply fears as extreme cold could cause production to shut temporarily, like what happened in Texas a year ago.
Bitcoin
Bitcoin was up more than 7% over the week, making most of those gains after Friday.
Data the Fed is Watching
What the latest Jobs Report Tells Us
Employers added 467,000 jobs in January. The figure is much higher than what economists projected (-250,000 to 250,000). Historically, there are data measurement issues and quirks (temporary workers are hired for the holiday season and let go after) associated with the January jobs report.
The unemployment rate rose slightly to 4.0% from 3.9%. Previously reported figures in November and December were also revised upwards. The labor department now says that employers added 647,000 jobs in November, up from the 249,000 reported previously, and 510,000 in December, up from 199,000. Taken together, there is little doubt that the US economy is showing resilient employment growth despite the Omicron wave.
What Does This Mean?
Job creation is undeniably strong in the last three months, this paves the way for more quantitative tightening (QT). There are two main levers for tightening: 1. Increase interest rates. 2. Speed up the pace of balance sheet runoff.
As compared to a week ago, the probability of a double hike in March, where the Fed funds rate is raised by 2 notches (50bps) instead of 1 (25bps) has increased from 8% to 14%. For this to happen, most committee members would have to agree that the Fed is behind the curve. Squeezing in two hikes in one meeting would be quite unorthodox and could result in more volatility in the market and less maneuverability for the Fed.
So far, the Fed has said that it will be shrinking their balance sheet (which ballooned during QE) according to the maturity schedule of bonds held rather than selling the bonds outright. It seems less certain that they can hold on to this promise considering strong employment growth and high inflation. We will know more after the minutes from the January FOMC meeting are released in the following week.
Big Tech Whiplash
S&P500 recovered earlier this week with spectacular earnings from Alphabet, the parent company of Google. Earnings and forward guidance from Meta, the parent company of Facebook, had the opposite effect. Meta recorded the worst one day drop in value for any company in history, falling more than 26% and erasing $230billion off its market value. Investors offloaded positions as Facebook lost users globally for the first time and spent $10billion building the metaverse, while potentially also giving up that same amount as ad-targeting becomes less effective with changes in privacy controls for Apple users.
Unlike Meta, Google capitalized Meta’s stumble during the same period. E-commerce search advertising was a key driver of revenue for Google as it is less dependent on Apple for user data. Alphabet also announced a 20-for-1 stock split, leading to speculation that it could join the Dow Jones industrial average.
Shares of Snap also fell midweek before rallying 50% post earnings release as it announced its first quarterly profit. Amazon fell in sympathy with Meta before gaining more than 15%. Amazon’s net income rose sharply due to its stake in Rivian, an electric vehicle maker. Without countering “pre-tax valuation gain” from Rivian, net income would have fallen to $2.5billion vs. $7.2billion a year ago.
Read more here: https://www.syfe.com/magazine/key-market-moves-this-week/
Can’t Quit Oil
Exxon Mobil, the largest American oil company showed off its best earnings report in seven years. In 2021, Exxon earned $23 billion, compared to a loss of $22 billion in 2020, when oil and gas prices fell to all-time lows. Exxon, along with Chevron plan to ramp up production in 2022, riding the wave of higher prices. However, pipeline issues in Ecuador, unrest in Kazakhstan and geopolitical tensions in Russia/Ukraine have limited global output recently.
In the short term, energy prices are expected to remain elevated, but EIA (the statistical agency of Department of Energy) predicts that we should see lower oil prices towards the end of the year.
While energy stocks were the best performing sector in 2021, returning 55% vs. 29% for the broad S&P500 index, the sector may still have some ways to go in 2022. Goldman Sachs argues in their 2022 Investment Outlook Report that “valuations are attractive as the sector is priced 26% below its five-year average price-to-cash flow ratio”.
Winter Storms May Cause Production Halts in the Near Term
Last year’s winter storms in the United States were catastrophic and sent gas and power prices up. This year, demand is high while supply could again be severely constrained due to the wintry weather. In the chart below, we saw a sharp drop in production when weather conditions were severe in Texas this time last year.
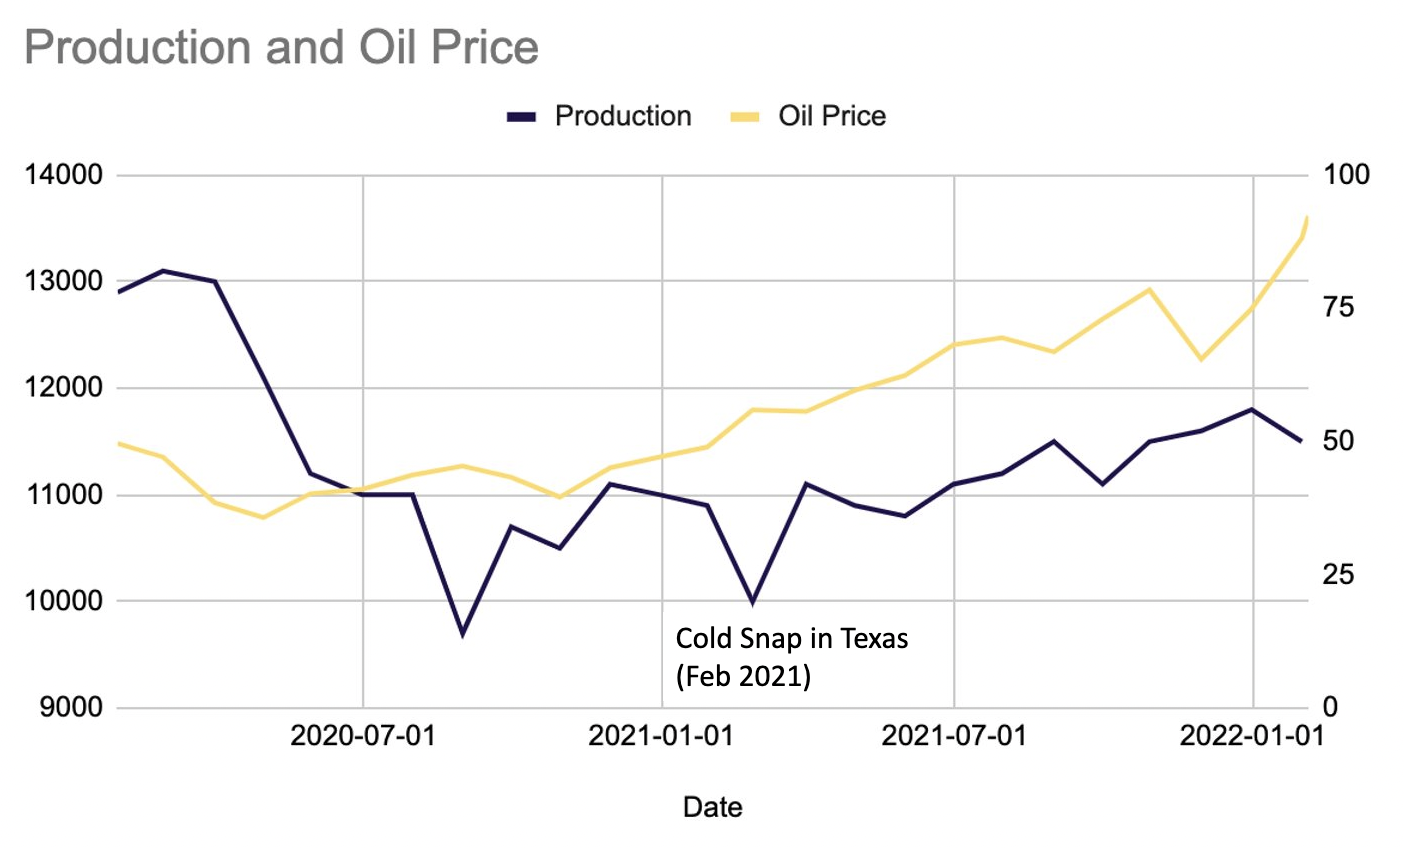
Winter storms are fuelling supply fears as extreme cold could cause production to shut temporarily, similar to what happened in Texas a year ago.
Source: Bloomberg, Weather.gov. As of Feb 04, 2022.
What to expect next week
Southern Copper: SCC is one of the largest integrated copper producers. Copper, along with Nickel, Lithium, Cobalt is vital to Electric vehicles and the clean energy industry.
Disney: Disney+ and Parks. Netflix fell more than 20% due to lower-than-expected subscriber growth. Will Disney+ move closer to its target of 240-260 million subscribers by 2024?
Coca-Cola and Pepsi: Large consumer staple names that have done well in recent quarters, along with the shift to value stocks.
PMI from China and Singapore: The Purchasing Managers’ Index (PMI) tells us whether the manufacturing sector is expected to expand or contract. Readings above 50 indicate an expansion, while those below 50 a contraction.
Important Information and Disclosure
Equity Price Level and Returns: All returns represent the total return for stated period. MSCI ACWI: Global equity index provided by Morgan Stanley Capital International (MSCI). S&P 500: Market capitalization index of U.S stocks provided by Standard & Poor’s (S&P). Dow Jones: Price-weighted index of U.S stocks provided by S&P. NASDAQ: Market capitalization index of U.S stocks provided by NASDAQ. Stoxx 600: Market capitalization index of stocks listed in European region. MSCI Asia Ex Japan: Asia excluding Japan equity index provided by MSCI. MSCI EM: Emerging markets equity index provided by MSCI. SSE: Capitalization weighted index of all A-shares and B-shares listed on Shanghai Stock Exchange. STI: Market capitalization index of stocks listed on Singapore Exchange. SREITLSP: Market capitalization index of the most liquid real estate investment trusts in Singapore.
Fixed Income Yield and Returns: All returns represent total
return for stated period. Global Aggregate: Global investment grade debt from both developed and emerging markets issuers. U.S. Aggregate, U.S Corporate, High Yield provided by Bloomberg Barclays Indices, ICE Data Services & WSJ. SBIF: ABF Singapore bond index fund provided by Nikko AM.
Key Interest Rates: 2-Year U.S Treasuries, 10 Year Treasuries, Bloomberg. 1-month, 3-month SIBOR: Singapore Interbank Offered Rates provided by Association of Banks in Singapore (ABS). Oil (WTI): Global oil benchmark, Bloomberg. Gold: Gold Spot USD/Oz, Bloomberg. DXY Index: U.S. Dollar Index, Bloomberg. VIX: Expectation of volatility based on S&P index options provided by Chicago Board Options Exchange (CBOE).
The information provided herein is intended for general circulation and/or discussion purposes only. It does not account for the specific investment objectives, financial situation or needs of any individual. The information in this document is not intended to constitute research analysis or recommendation and should not be treated as such.
This does not constitute an offer or solicitation to buy/sell any financial instrument or to participate any investment strategy. No representation or warranty whatsoever (without limiting to accuracy, usefulness, adequacy, timeliness or completeness) in respect of any information (without limiting to any statement, figures, opinion, view or estimate). Syfe does not undertake an obligation to update the information or to correct any inaccuracy that may become apparent at a later time. All information presented is subject to change without notice. Syfe shall not be responsible or liable for any loss or damage whatsoever arising directly or indirectly as a result of any person acting on any information provided herein.
The information provided herein may contain projections or other forward-looking statement regarding future events or future performance of countries, assets, markets or companies. Actual events or results may differ materially. Past performance figures are not necessarily indicative of future of likely performance. Any reference to any specific company, financial product or asset class in whatever way is used for illustrative purposes only and does not constitute a recommendation. Investors should note that there are necessarily limitations and difficulties in using any graph, chart, formula or other device to determine whether or not, or if so, when to, make an investment. The contents hereof are considered proprietary information and may not be produced or disseminated in whole or in part without Syfe’s written consent.

You must be logged in to post a comment.