
Thought Of The Week
U.S July CPI, PPI
While the latest consumer price index (CPI) showed that inflation pressures remain elevated in July, markets were reassured since the prices increased at a slower pace. The year-on-year CPI held steady at 5.4% and the increases were more acute in economy reopening sectors such as airfares and used cars, which bolstered the Federal Reserve’s argument that inflation is transitory. On the other hand, producer price index (PPI) rose more than economists forecast, suggesting that companies are still facing inflationary pressures due to higher commodity costs and supply bottlenecks. So far, they have been successful in passing these costs to consumers which is evident from the record levels in profit margins this past earnings season and strong demand in consumer goods demand. If the consumers’ income growth is unable to keep pace with headline inflation and the pent-up demand from lockdowns dries up, then upward pressure on prices will be limited. Nonetheless, markets (and policymakers likewise) remain divided which will continue to spur months of debate on inflation. S&P 500 and Dow Jones Industrial Average set multiple record closes this week while the technology focused Nasdaq Composite, more susceptible to strong inflation pushing up interest rates, remained flat for the week.
The “Low” Returns
Many investors seem to be looking for investments that can generate 10x these days and the idea of a steady, reliable diversified portfolio is becoming frighteningly passe. Highflying investments such as meme stocks and crypto assets have largely been sensationalized and investors are conditioned to believe that investing equates to “growing to the moon”. In its latest survey, Natixis SA reported that individual investors expect their portfolios to generate a long-term return of 17.5% p.a compared to professionally managed endowments who count themselves lucky for generating 8% p.a.
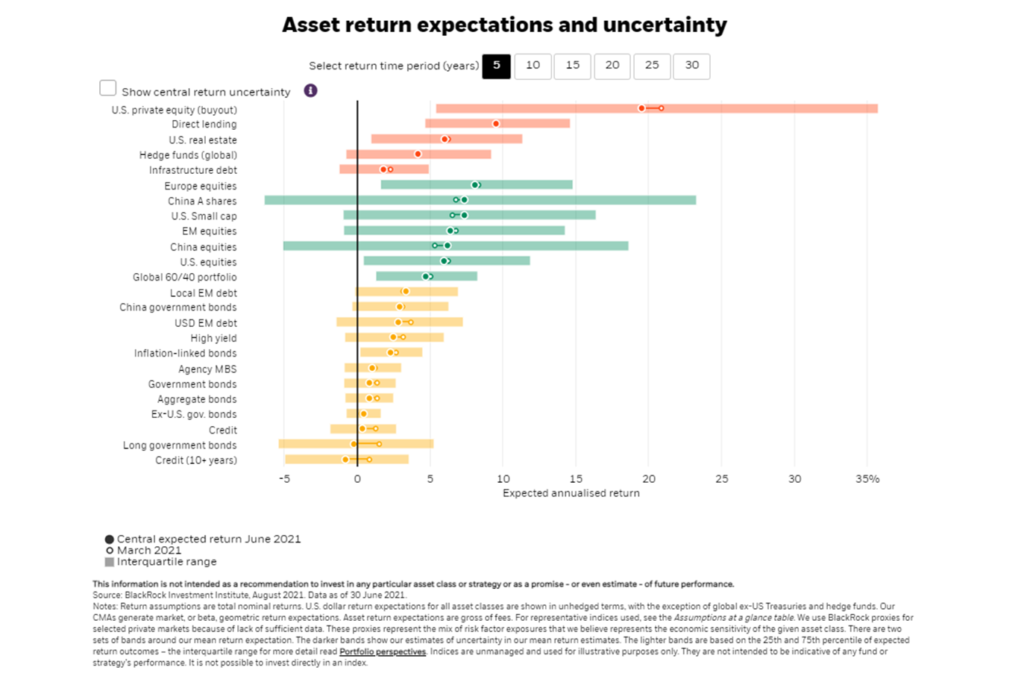
According to BlackRock Inc., the biggest money manager on the planet, its highest mean expected return over the next 30 years is about 16% p.a from private equity while every other asset class has an expected return of less than 10% p.a, and half of them are less than 5% p.a. Given that many assets are expensive and elevated valuations will drag on future returns, the expected returns for a 5-year horizon are even more modest. While there is little harm setting aside some play money to chase the next 10X, investors should not be under the misguided belief that profits earned over a lifetime of disciplined investing can be achieved overnight. The smarter path is as boring as it is obvious: Invest in a diversified portfolio of low-cost funds and keep in mind that money doesn’t fly, it crawls.
Chart Of The Week
Important Information and Disclosure
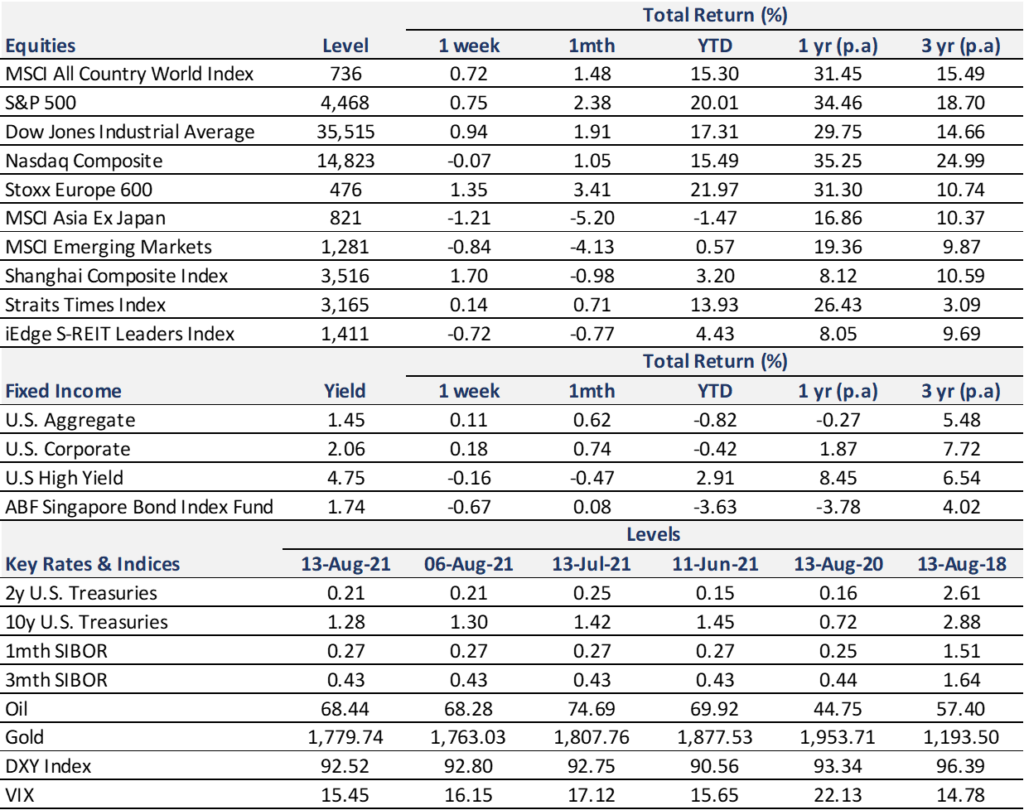
Equity Price Level and Returns: All returns represent the total return for stated period. MSCI ACWI: Global equity index provided by Morgan Stanley Capital International (MSCI). S&P 500: Market capitalization index of U.S stocks provided by Standard & Poor’s (S&P). Dow Jones: Price-weighted index of U.S stocks provided by S&P. NASDAQ: Market capitalization index of U.S stocks provided by NASDAQ. Stoxx 600: Market capitalization index of stocks listed in European region. MSCI Asia Ex Japan: Asia excluding Japan equity index provided by MSCI. MSCI EM: Emerging markets equity index provided by MSCI. SSE: Capitalization weighted index of all A-shares and B-shares listed on Shanghai Stock Exchange. STI: Market capitalization index of stocks listed on Singapore Exchange. SREITLSP: Market capitalization index of the most liquid real estate investment trusts in Singapore.
Fixed Income Yield and Returns: All returns represent total return for stated period. Global Aggregate: Global investment grade debt from both developed and emerging markets issuers. U.S. Aggregate, U.S Corporate, High Yield provided by Bloomberg Barclays Indices, ICE Data Services & WSJ. SBIF: ABF Singapore bond index fund provided by Nikko AM.
Key Interest Rates: 2-Year U.S Treasuries, 10 Year Treasuries, Bloomberg. 1-month, 3-month SIBOR: Singapore Interbank Offered Rates provided by Association of Banks in Singapore (ABS). Oil (WTI): Global oil benchmark, Bloomberg. Gold: Gold Spot USD/Oz, Bloomberg. DXY Index: U.S. Dollar Index, Bloomberg. VIX: Expectation of volatility based on S&P index options provided by Chicago Board Options Exchange (CBOE).
The information provided herein is intended for general circulation and/or discussion purposes only. It does not account for the specific investment objectives, financial situation or needs of any individual. The information in this document is not intended to constitute research analysis or recommendation and should not be treated as such.
This does not constitute an offer or solicitation to buy/sell any financial instrument or to participate any investment strategy. No representation or warranty whatsoever (without limiting to accuracy, usefulness, adequacy, timeliness or completeness) in respect of any information (without limiting to any statement, figures, opinion, view or estimate). Syfe does not undertake an obligation to update the information or to correct any inaccuracy that may become apparent at a later time. All information presented is subject to change without notice. Syfe shall not be responsible or liable for any loss or damage whatsoever arising directly or indirectly as a result of any person acting on any information provided herein.
The information provided herein may contain projections or other forward-looking statement regarding future events or future performance of countries, assets, markets or companies. Actual events or results may differ materially. Past performance figures are not necessarily indicative of future of likely performance. Any reference to any specific company, financial product or asset class in whatever way is used for illustrative purposes only and does not constitute a recommendation. Investors should note that there are necessarily limitations and difficulties in using any graph, chart, formula or other device to determine whether or not, or if so, when to, make an investment. The contents hereof are considered proprietary information and may not be produced or disseminated in whole or in part without Syfe’s written consent.

You must be logged in to post a comment.