
Thought Of The Week
US October Retail Sales
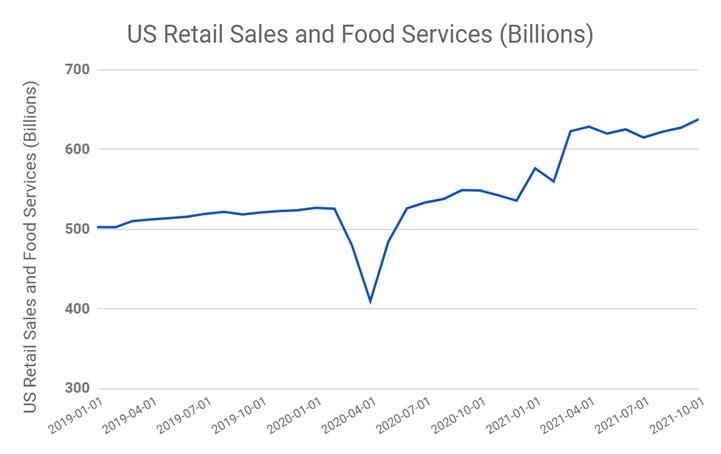
US retail sales and food services rose by 1.7% for the month of October. This marked the largest gain since March and topped economists estimates of a 1.4% increase. The increase was primarily led by automobile sales which rose 1.8%. Notably online sales rose 4% and service station sales rose 3.9% due to higher gas prices. The core retail sales which excludes automobile spend, fuel, building materials and food services only rose 1.6% which suggests that consumer discretionary spending in the US had increased. This signified that US consumers were unperturbed by the high inflation and COVID backdrop which strongly hints at a strong holiday season this year. Further forecasting a great sales season was data from Walmart. Walmart US inventory rose 11.5% as the company stocked up early for the holiday season in order to prepare for “a strong holiday season”.
The strong sales data bode well with equities – the S&P 500 rose 0.39% and the S&P 500 consumer discretionary sector rose 1.38% on Tuesday. Treasury prices also declined upon the data release.
US EV Makers
Lucid Group market capitalization surpassed Ford Motors on Tuesday with a market capitalization of around USD 90 billion. However, Lucid’s share price was still notably below the 52 weeks peak of almost $65 in February when it announced it was reaching a deal. Rivian, which went IPO last week, was on a week-long post IPO surge. Many investors are betting that Rivian could replicate the success of Tesla especially with Rivian’s impressively huge order book of 50,000 trucks and 100,000 vans from Amazon. However, it is noteworthy that Rivian is still far from the scale of Tesla. Rivian also strikingly snapped its post IPO winning streak on Wednesday by sharply pulling back with intraday losses reaching as much as 18%. The volatility highlights the risk of purchasing EV companies which are yet to ramp up production. Tesla shares held up well this week with 4 consecutive days of rebound after a drop last week when Elon Musk sold nearly 8.2m shares in partial fulfilment of his twitter pledge to sell a 10% stake in Tesla. The elevated buying interest signified investors viewed the pull back as a passing phase and an opportunity to increase their stake.
Europe Gas Prices
Earlier this week, Germany decided to suspend the approval of the Nord Stream 2 gas pipeline. This was amidst much political controversy and despite the backdrop of high gas prices and supply crunch in Europe. Germany claimed they would only approve the pipeline after the assets were transferred to Germany and when the company was in full compliance with German law. The suspension of the pipeline caused a strong reaction in the gas futures markets with Dutch prices rising 18% and UK prices rising 17% on Tuesday. US gas prices were not spared either, with futures rising 3.2% on Tuesday.
Chart Of The Week
Important Information and Disclosure
Equity Price Level and Returns: All returns represent the total return for stated period. MSCI ACWI: Global equity index provided by Morgan Stanley Capital International (MSCI). S&P 500: Market capitalization index of U.S stocks provided by Standard & Poor’s (S&P). Dow Jones: Price-weighted index of U.S stocks provided by S&P. NASDAQ: Market capitalization index of U.S stocks provided by NASDAQ. Stoxx 600: Market capitalization index of stocks listed in European region. MSCI Asia Ex Japan: Asia excluding Japan equity index provided by MSCI. MSCI EM: Emerging markets equity index provided by MSCI. SSE: Capitalization weighted index of all A-shares and B-shares listed on Shanghai Stock Exchange. STI: Market capitalization index of stocks listed on Singapore Exchange. SREITLSP: Market capitalization index of the most liquid real estate investment trusts in Singapore.
Fixed Income Yield and Returns: All returns represent total
return for stated period. Global Aggregate: Global investment grade debt from both developed and emerging markets issuers. U.S. Aggregate, U.S Corporate, High Yield provided by Bloomberg Barclays Indices, ICE Data Services & WSJ. SBIF: ABF Singapore bond index fund provided by Nikko AM.
Key Interest Rates: 2-Year U.S Treasuries, 10 Year Treasuries, Bloomberg. 1-month, 3-month SIBOR: Singapore Interbank Offered Rates provided by Association of Banks in Singapore (ABS). Oil (WTI): Global oil benchmark, Bloomberg. Gold: Gold Spot USD/Oz, Bloomberg. DXY Index: U.S. Dollar Index, Bloomberg. VIX: Expectation of volatility based on S&P index options provided by Chicago Board Options Exchange (CBOE).
The information provided herein is intended for general circulation and/or discussion purposes only. It does not account for the specific investment objectives, financial situation or needs of any individual. The information in this document is not intended to constitute research analysis or recommendation and should not be treated as such.
This does not constitute an offer or solicitation to buy/sell any financial instrument or to participate any investment strategy. No representation or warranty whatsoever (without limiting to accuracy, usefulness, adequacy, timeliness or completeness) in respect of any information (without limiting to any statement, figures, opinion, view or estimate). Syfe does not undertake an obligation to update the information or to correct any inaccuracy that may become apparent at a later time. All information presented is subject to change without notice. Syfe shall not be responsible or liable for any loss or damage whatsoever arising directly or indirectly as a result of any person acting on any information provided herein.
The information provided herein may contain projections or other forward-looking statement regarding future events or future performance of countries, assets, markets or companies. Actual events or results may differ materially. Past performance figures are not necessarily indicative of future of likely performance. Any reference to any specific company, financial product or asset class in whatever way is used for illustrative purposes only and does not constitute a recommendation. Investors should note that there are necessarily limitations and difficulties in using any graph, chart, formula or other device to determine whether or not, or if so, when to, make an investment. The contents hereof are considered proprietary information and may not be produced or disseminated in whole or in part without Syfe’s written consent.

You must be logged in to post a comment.