
Thought Of The Week
Fed Meeting Minutes, Global Minimum Tax
The minutes of the Federal Reserve meeting contained a couple of surprises that attracted traders’ attention. The vague hint at scaling back its bond-buying efforts “at some point in upcoming meetings” was linked to the strength of the economic bounce-back. Markets had a greater challenge in deciphering the significance of the statement this time since the latest U.S consumer inflation report was stronger-than-expected but the jobs report was surprisingly weak. Yet, it gave a glimpse that some of the members talked about talking about tapering.
Bond market took hint and treasury yields rose slightly after the minutes were released. Meanwhile, U.S revised its proposed global minimum corporate tax rate from 21% to 15% for the overseas earnings of U.S businesses. Tax havens including Ireland were unhappy with the earlier proposal as they depend on low business taxes as a key economic development strategy. However, as global trade becomes more localized, the global “race to the bottom” on company taxes may eventually fade. Major indexes snapped a three-day losing streak on Thursday but were little changed for the week.
U.K Consumers Revenge Spending
After months of lockdown and majority of the adult population partially vaccinated, U.K consumers are now ready to splurge their savings accumulated during the pandemic. April retail sales data were extremely strong, surging 9.2% as non-essential stores reopen while business confidence reached an all-time high. In addition, its Composite Output Index also rose to 62.0 in May, from 60.7 in April, signalling the fastest rate of growth since the index was first compiled more than two decades ago. The post-lockdown bounce from the pent-up demand and higher output levels are set to unleash a consumer-led recovery as the pandemic restrictions start to loosen.
Chinese Bonds vs U.S Treasuries
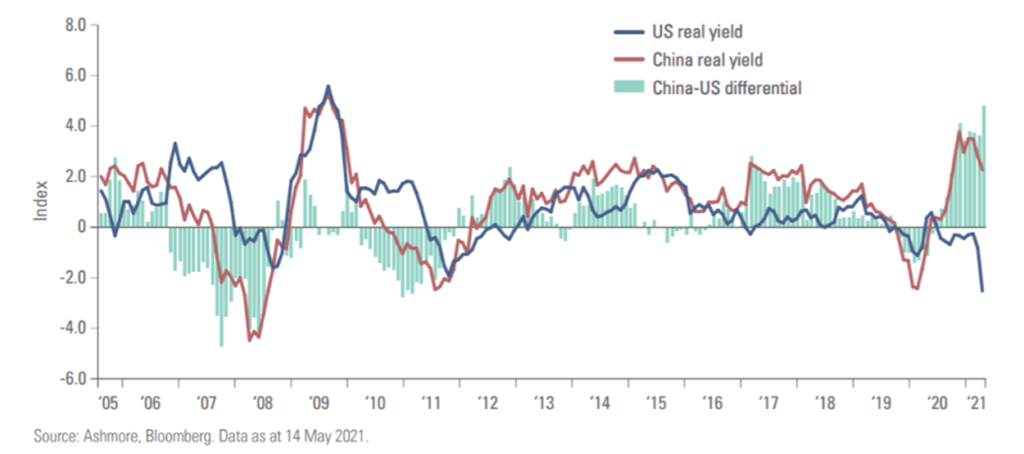
As the global economy starts to re-open with demand rising faster than supply, fears of inflation and market noises have been causing investors to jump on and off the bandwagons. Last week, U.S reported an outsized headline inflation of 4.2% year-on-year while core inflation jumped to 3.0% in April. According to the University of Michigan consumer sentiment survey, inflation expectations have also risen. With U.S headline inflation now running well above the average Emerging Market (EM) inflation of 3.9% year-on-year, it is interesting to compare the yield differentials between U.S Treasuries and Chinese bonds and their relative attractiveness.
China Consumer Price Index (CPI) inflation rose 0.9% while Producer Price Index (PPI) inflation surged to 6.8% on a year-on-year basis, mainly due to base effects following last year’s collapse in producer prices. Deflated by the latest CPI inflation print, the real 10-year US Treasury yield has dropped from +0.1% to -1.3. As a result, the China-U.S real yield differential currently trades at the largest spread ever. Given EM yield supremacy and the longer team dollar weakness, EM debt particularly Chinese bonds, are likely to continue perform nicely as an income generation tool.
Chart Of The Week
Important Information and Disclosure
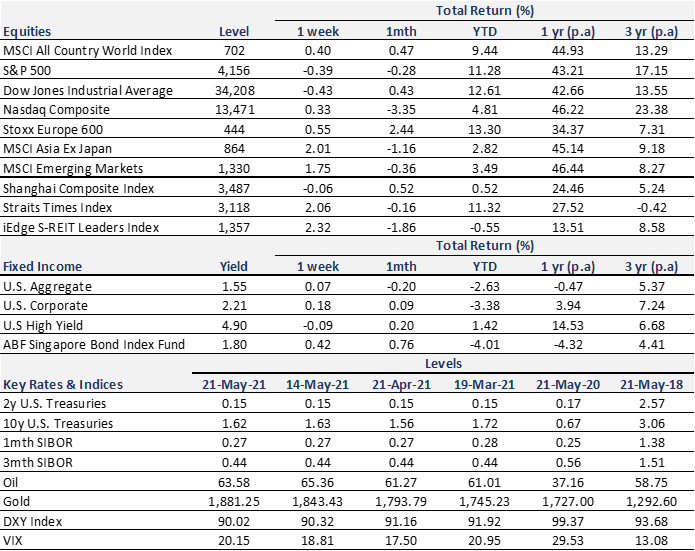
Equity Price Level and Returns: All returns represent the total return for stated period. MSCI ACWI: Global equity index provided by Morgan Stanley Capital International (MSCI). S&P 500: Market capitalization index of U.S stocks provided by Standard & Poor’s (S&P). Dow Jones: Price-weighted index of U.S stocks provided by S&P. NASDAQ: Market capitalization index of U.S stocks provided by NASDAQ. Stoxx 600: Market capitalization index of stocks listed in European region. MSCI Asia Ex Japan: Asia excluding Japan equity index provided by MSCI. MSCI EM: Emerging markets equity index provided by MSCI. SSE: Capitalization weighted index of all A-shares and B-shares listed on Shanghai Stock Exchange. STI: Market capitalization index of stocks listed on Singapore Exchange. SREITLSP: Market capitalization index of the most liquid real estate investment trusts in Singapore.
Fixed Income Yield and Returns: All returns represent total return for stated period. Global Aggregate: Global investment grade debt from both developed and emerging markets issuers. U.S. Aggregate, U.S Corporate, High Yield provided by Bloomberg Barclays Indices, ICE Data Services & WSJ. SBIF: ABF Singapore bond index fund provided by Nikko AM.
Key Interest Rates: 2-Year U.S Treasuries, 10 Year Treasuries, Bloomberg. 1-month, 3-month SIBOR: Singapore Interbank Offered Rates provided by Association of Banks in Singapore (ABS). Oil (WTI): Global oil benchmark, Bloomberg. Gold: Gold Spot USD/Oz, Bloomberg. DXY Index: U.S. Dollar Index, Bloomberg. VIX: Expectation of volatility based on S&P index options provided by Chicago Board Options Exchange (CBOE).
The information provided herein is intended for general circulation and/or discussion purposes only. It does not account for the specific investment objectives, financial situation or needs of any individual. The information in this document is not intended to constitute research analysis or recommendation and should not be treated as such.
This does not constitute an offer or solicitation to buy/sell any financial instrument or to participate any investment strategy. No representation or warranty whatsoever (without limiting to accuracy, usefulness, adequacy, timeliness or completeness) in respect of any information (without limiting to any statement, figures, opinion, view or estimate). Syfe does not undertake an obligation to update the information or to correct any inaccuracy that may become apparent at a later time. All information presented is subject to change without notice. Syfe shall not be responsible or liable for any loss or damage whatsoever arising directly or indirectly as a result of any person acting on any information provided herein.
The information provided herein may contain projections or other forward-looking statement regarding future events or future performance of countries, assets, markets or companies. Actual events or results may differ materially. Past performance figures are not necessarily indicative of future of likely performance. Any reference to any specific company, financial product or asset class in whatever way is used for illustrative purposes only and does not constitute a recommendation. Investors should note that there are necessarily limitations and difficulties in using any graph, chart, formula or other device to determine whether or not, or if so, when to, make an investment. The contents hereof are considered proprietary information and may not be produced or disseminated in whole or in part without Syfe’s written consent.

You must be logged in to post a comment.