
The Week Ahead
- China PMI
- U.K PMI
- U.S Nonfarm Payrolls and Unemployment Rate
Thought Of The Week
Economic Restart, U.S-China Trade Talks
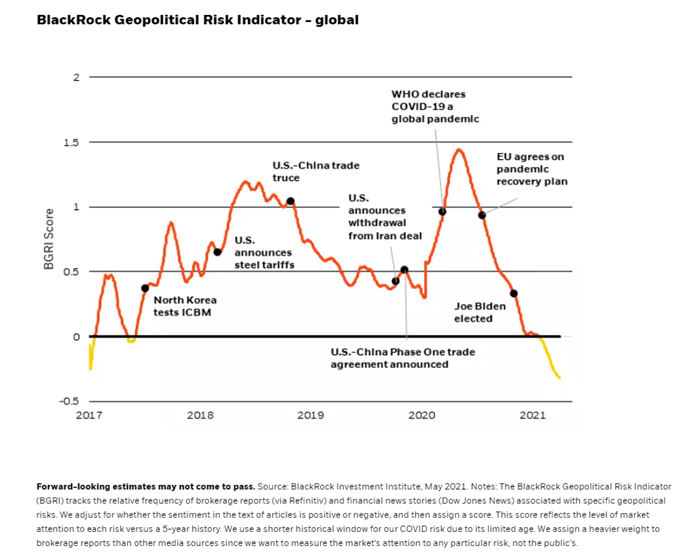
Global stocks are set to climb for a fourth month, supported by solid economic data and accommodative monetary policy by central banks. U.S weekly jobless claims continue to drop to a fresh pandemic low while comments from Federal Reserve helped to temper inflation fears again. Meanwhile, U.S Trade Representative Katherine Tai and China’s Vice Premier Liu He had their first conversation on Thursday as both sides try to resolve their differences on trade. Despite the existing tariffs that the U.S and China have in place, bilateral trade is in fact rebounding, highlighting the strong economic interdependence of the two nations. Although there has not been any major change to the policies inherited from the former U.S President, there are increasing signs that U.S will be moving away from engagement to a “new set of strategic parameters” that will be focused on competition with China. According to BlackRock Investment Institute, the global BlackRock Geopolitical Risk Indicators (BGRI) score has been trending down in the past year due to fading attention to risks such as U.S.-China strategic competition, Covid-19 resurgence and Gulf tensions. This indicates a significant reduction in concern about geopolitical risk since the change in U.S administration. As markets continue to focus on economic restart and inflation, it is also worth keeping an eye for geopolitical risk flareups. Stocks ended the week higher while the dollar was little changed.
Active Trading Is a Loser’s Game
Day trading has become very popular worldwide since the onset of the coronavirus pandemic. Bored at home, many people have turned to dabble in the stock market and cryptocurrencies for entertainment and profits. However, can one successfully time the market by actively going in and out of it to generate profits on a consistent basis? In the newest edition of “Winning the Loser’s Game”, author Charles Ellis states that “Over one year, 70% of mutual funds underperform their chosen benchmarks. Over 10 years, it gets worse: 80% underperform and 15 years later, the number is nearly 90%.”
The difficulty in outperforming the markets is even higher for day trading since you need to be able to predict a company’s performance correctly and “be there when the lightning strikes” to capitalize on price fluctuations. A study using the S&P 500 showed that all the total returns over a 20-year period were achieved in the best 35 days, which is less than 1% of the 5,000 trading days during the period.
To avoid getting sucked into this loser’s game, Ellis advises investors to find a balance between their zone of competence and their zone of comfort. Stay with index funds if you are not skilled in picking stocks or funds, or investment managers. Reduce your market exposure to a level which you feel comfortable and rational. Whatever you do, stick with it. The key takeaway is “Don’t go outside your zone of competence because you’ll make costly mistakes; And don’t go outside your comfort zone because you may get emotional and being emotional is never good for your investing.”
Chart Of The Week
Important Information and Disclosure
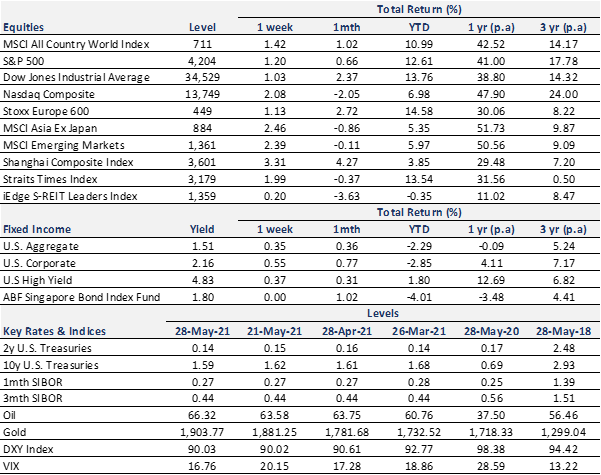
Equity Price Level and Returns: All returns represent the total return for stated period. MSCI ACWI: Global equity index provided by Morgan Stanley Capital International (MSCI). S&P 500: Market capitalization index of U.S stocks provided by Standard & Poor’s (S&P). Dow Jones: Price-weighted index of U.S stocks provided by S&P. NASDAQ: Market capitalization index of U.S stocks provided by NASDAQ. Stoxx 600: Market capitalization index of stocks listed in European region. MSCI Asia Ex Japan: Asia excluding Japan equity index provided by MSCI. MSCI EM: Emerging markets equity index provided by MSCI. SSE: Capitalization weighted index of all A-shares and B-shares listed on Shanghai Stock Exchange. STI: Market capitalization index of stocks listed on Singapore Exchange. SREITLSP: Market capitalization index of the most liquid real estate investment trusts in Singapore.
Fixed Income Yield and Returns: All returns represent total return for stated period. Global Aggregate: Global investment grade debt from both developed and emerging markets issuers. U.S. Aggregate, U.S Corporate, High Yield provided by Bloomberg Barclays Indices, ICE Data Services & WSJ. SBIF: ABF Singapore bond index fund provided by Nikko AM.
Key Interest Rates: 2-Year U.S Treasuries, 10 Year Treasuries, Bloomberg. 1-month, 3-month SIBOR: Singapore Interbank Offered Rates provided by Association of Banks in Singapore (ABS). Oil (WTI): Global oil benchmark, Bloomberg. Gold: Gold Spot USD/Oz, Bloomberg. DXY Index: U.S. Dollar Index, Bloomberg. VIX: Expectation of volatility based on S&P index options provided by Chicago Board Options Exchange (CBOE).
The information provided herein is intended for general circulation and/or discussion purposes only. It does not account for the specific investment objectives, financial situation or needs of any individual. The information in this document is not intended to constitute research analysis or recommendation and should not be treated as such.
This does not constitute an offer or solicitation to buy/sell any financial instrument or to participate any investment strategy. No representation or warranty whatsoever (without limiting to accuracy, usefulness, adequacy, timeliness or completeness) in respect of any information (without limiting to any statement, figures, opinion, view or estimate). Syfe does not undertake an obligation to update the information or to correct any inaccuracy that may become apparent at a later time. All information presented is subject to change without notice. Syfe shall not be responsible or liable for any loss or damage whatsoever arising directly or indirectly as a result of any person acting on any information provided herein.
The information provided herein may contain projections or other forward-looking statement regarding future events or future performance of countries, assets, markets or companies. Actual events or results may differ materially. Past performance figures are not necessarily indicative of future of likely performance. Any reference to any specific company, financial product or asset class in whatever way is used for illustrative purposes only and does not constitute a recommendation. Investors should note that there are necessarily limitations and difficulties in using any graph, chart, formula or other device to determine whether or not, or if so, when to, make an investment. The contents hereof are considered proprietary information and may not be produced or disseminated in whole or in part without Syfe’s written consent.

You must be logged in to post a comment.