
Thought Of The Week
U.S Infrastructure Plan, VIX Returns to Pre-Pandemic
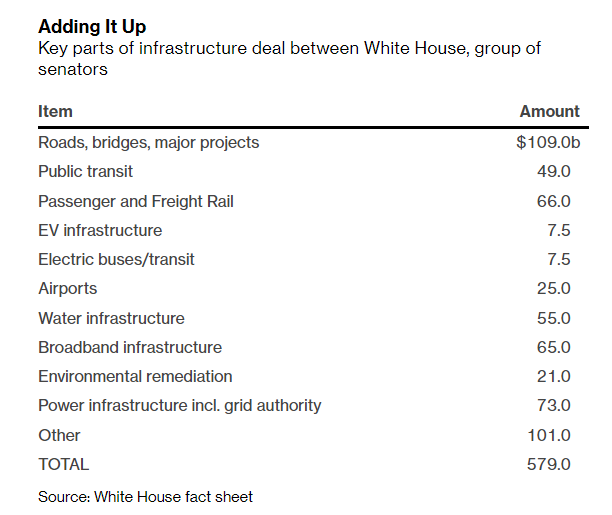
Stocks climbed to an all-time high this week after U.S President Biden agreed to a bipartisan $579 billion infrastructure deal which includes investments in transportation, water and broadband. Economically sensitive shares such as financials and energy led gains in the S&P 500 since they stand to benefit the most from a rebound in activity. However, this “spending” is more of a redistribution of existing federal funds that were unspent from previous packages (which markets have already assumed that would be spent) rather than a stimulus. It is also uncertain whether this bipartisan legislation will pass Congress since it will be moving alongside a more massive secondary bill that requires spending trillions more on what Biden called “human infrastructure” which the Republicans oppose. Given Democrats’ thin majorities in Congress, the passage is likely to be a slow and difficult grind that will take weeks of delicate negotiations between Republicans and Democrats. Nonetheless, the deal eased some anxiety from the Federal Reserve’s hawkish tilt for with VIX tumbling to pre-pandemic levels.
Big Banks Stress Test
The Federal Reserve gave 23 large U.S banks a clean bill of health as they emerge from the pandemic, paving the way for these lenders to boost their dividend payments and share buybacks after June 30. The stress tests gauge banks’ ability to maintain strong capital levels and keep lending to businesses and households in a severe recession. In a worst-case scenario where U.S sees a double-digit unemployment, GDP falls for seven straight quarters and stock prices drop more than 55%, their capital ratios would decline to 10.6%, which is still be more than double of their minimum requirements. The Fed typically performs the test annually but has ran three stress tests over the past year with several different hypothetical recessions, and all have confirmed assuring results. Analysts anticipate that the loosening of these restrictions could return up $200 billion to their shareholders over the coming year and would likely create another bounce for the stocks.
Chart Of The Week
Important Information and Disclosure
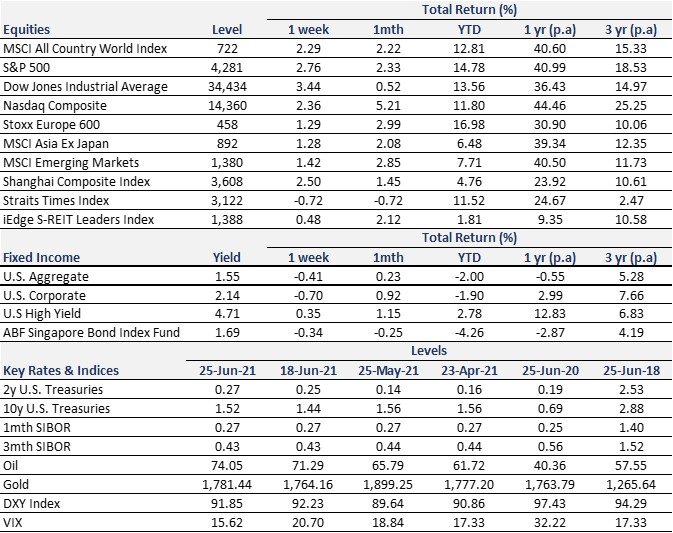
Equity Price Level and Returns: All returns represent the total return for stated period. MSCI ACWI: Global equity index provided by Morgan Stanley Capital International (MSCI). S&P 500: Market capitalization index of U.S stocks provided by Standard & Poor’s (S&P). Dow Jones: Price-weighted index of U.S stocks provided by S&P. NASDAQ: Market capitalization index of U.S stocks provided by NASDAQ. Stoxx 600: Market capitalization index of stocks listed in European region. MSCI Asia Ex Japan: Asia excluding Japan equity index provided by MSCI. MSCI EM: Emerging markets equity index provided by MSCI. SSE: Capitalization weighted index of all A-shares and B-shares listed on Shanghai Stock Exchange. STI: Market capitalization index of stocks listed on Singapore Exchange. SREITLSP: Market capitalization index of the most liquid real estate investment trusts in Singapore.
Fixed Income Yield and Returns: All returns represent total return for stated period. Global Aggregate: Global investment grade debt from both developed and emerging markets issuers. U.S. Aggregate, U.S Corporate, High Yield provided by Bloomberg Barclays Indices, ICE Data Services & WSJ. SBIF: ABF Singapore bond index fund provided by Nikko AM.
Key Interest Rates: 2-Year U.S Treasuries, 10 Year Treasuries, Bloomberg. 1-month, 3-month SIBOR: Singapore Interbank Offered Rates provided by Association of Banks in Singapore (ABS). Oil (WTI): Global oil benchmark, Bloomberg. Gold: Gold Spot USD/Oz, Bloomberg. DXY Index: U.S. Dollar Index, Bloomberg. VIX: Expectation of volatility based on S&P index options provided by Chicago Board Options Exchange (CBOE).
The information provided herein is intended for general circulation and/or discussion purposes only. It does not account for the specific investment objectives, financial situation or needs of any individual. The information in this document is not intended to constitute research analysis or recommendation and should not be treated as such.
This does not constitute an offer or solicitation to buy/sell any financial instrument or to participate any investment strategy. No representation or warranty whatsoever (without limiting to accuracy, usefulness, adequacy, timeliness or completeness) in respect of any information (without limiting to any statement, figures, opinion, view or estimate). Syfe does not undertake an obligation to update the information or to correct any inaccuracy that may become apparent at a later time. All information presented is subject to change without notice. Syfe shall not be responsible or liable for any loss or damage whatsoever arising directly or indirectly as a result of any person acting on any information provided herein.
The information provided herein may contain projections or other forward-looking statement regarding future events or future performance of countries, assets, markets or companies. Actual events or results may differ materially. Past performance figures are not necessarily indicative of future of likely performance. Any reference to any specific company, financial product or asset class in whatever way is used for illustrative purposes only and does not constitute a recommendation. Investors should note that there are necessarily limitations and difficulties in using any graph, chart, formula or other device to determine whether or not, or if so, when to, make an investment. The contents hereof are considered proprietary information and may not be produced or disseminated in whole or in part without Syfe’s written consent.

You must be logged in to post a comment.