
Thought Of The Week
U.S July Jobs Report, Q2 Earnings Surprise
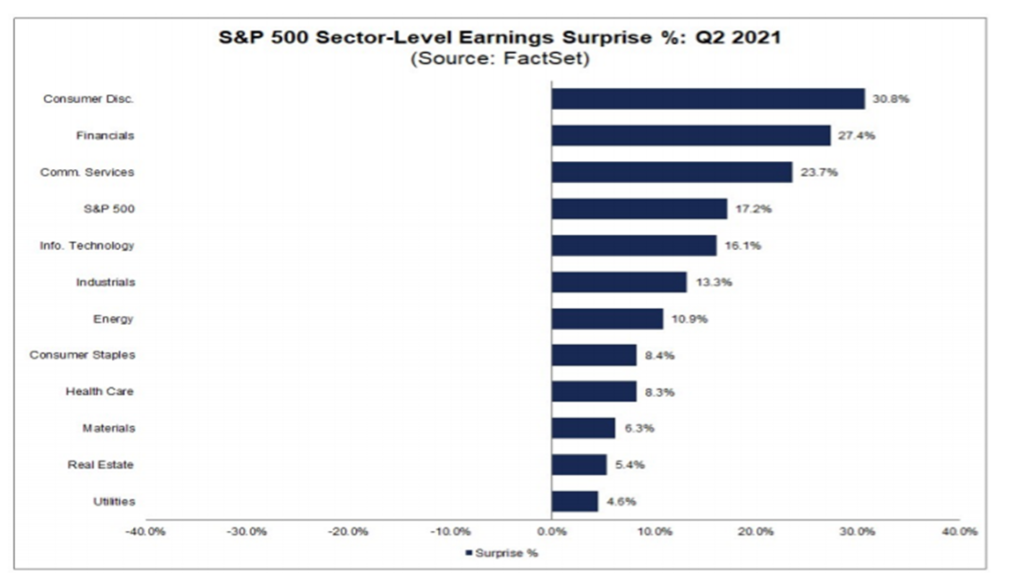
U.S labour market continues to deliver strong recovery with July payrolls climbing 943,000 compared to market estimates of 938,000 and unemployment rate declined to 5.4%. Approximately two-thirds of the overall increase came from leisure and hospitality industry even though gains in health services, transportation and manufacturing were notable too. While some investors speculate that the Fed may start tapering in October, we should not forget that most of these jobless workers are still receiving $300 weekly unemployment benefits till September 6 and other ongoing concerns such as of catching the virus and childcare responsibilities have strongly disincentivised them to return to workforce. With payrolls still far below pre-pandemic levels (5.7 million), policymakers remain cautious on making their next move prematurely since it may threaten the pace of job growth. Meanwhile, 60% of the S&P 500 companies have announced their Q2 results and 88% of them reported a positive surprise. So far, markets seem to be rewarding positive earnings surprises more than average and punishing negative earning, resulting in S&P 500 and Nasdaq to reach fresh peaks buoyed by solid earnings.
Another Wild Week for Chinese Stocks
Continuing with its relentless efforts to rein in sectors that could threaten its national strategic objectives, China’s regulators again expanded its target list this week, leaving skittish investors very watchful for the next one on radar especially since the crackdown has triggered a $1 trillion global selloff last month. This week’s casualties include the internet gaming (criticized as “spiritual opium” for teenagers), liquor and e-cigarette (highlighted as links between alcohol and cancer) and biopharmaceuticals sector (condemned the misuse of human growth hormone injections). However, other sectors were favoured such as sportswear, renewable energy and semiconductors with the government’s desire to improve people’s physical fitness, achieve carbon-neutral status and have semiconductor independence to power its long-term economy.
What happened to Evergrande?
It was once the world’s most valuable real estate company and was ranked 152nd in the 2020 Fortune Global 500 list. Year-to-date, China Evergrande Group’s stock has plummeted 63% and its debt rating has been slashed deeper to one of the lowest levels of junk by S&P CCC, just four notches above the designation for defaulted borrowers. Given that its August 22 bonds 22 have once traded at a YTM of 122%, it is appalling that Evergrande is the now most heavily indebted China property developers. While Evergrande has been offloading assets and listing units to overcome this liquidity crisis, and Tencent buying some of these technology subsidiaries to sort of bail out Evergrande, it is possible that a default could be avoided. Policymakers in Beijing have so far remained silent about the possibility of supporting Evergrande, but market rumour has it that they consider that debt issue of Evergrande is liquidity issue instead of net debt (total debt bigger than the total assets), which Evergrande only need to divest some of its assets. This comment from the State Council, if turn into real, can comfort the market that there would NOT be systematic risk Evergrande brings into the China credit market.
Chart Of The Week
Important Information and Disclosure
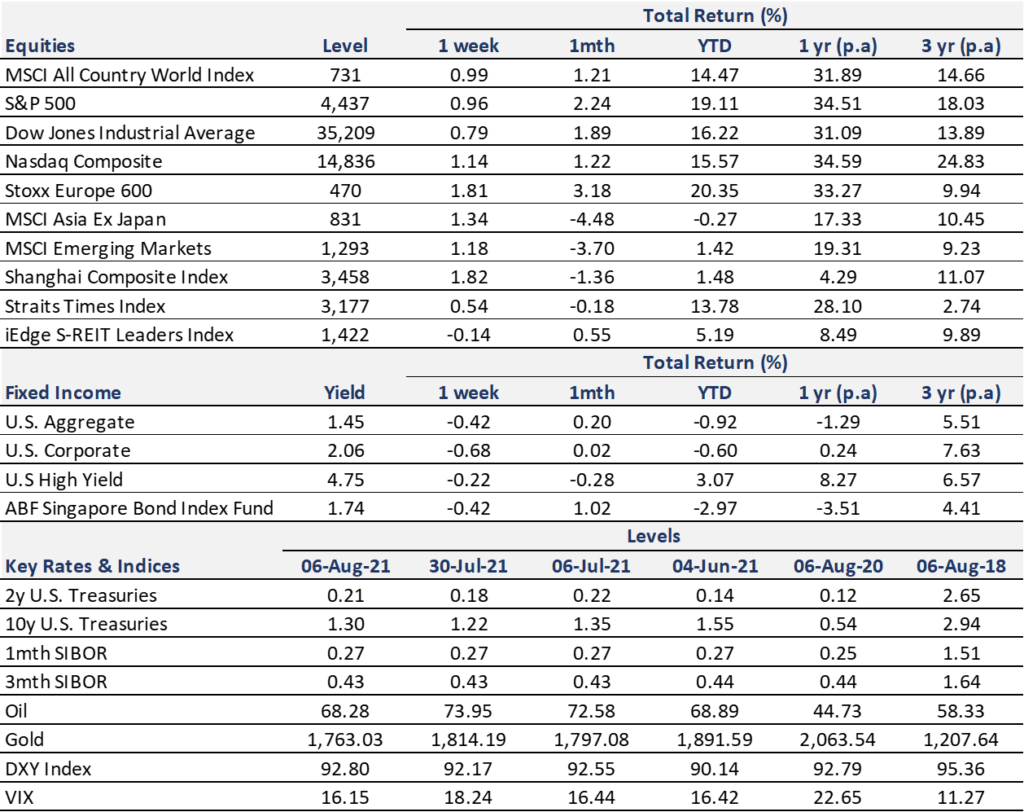
Equity Price Level and Returns: All returns represent the total return for stated period. MSCI ACWI: Global equity index provided by Morgan Stanley Capital International (MSCI). S&P 500: Market capitalization index of U.S stocks provided by Standard & Poor’s (S&P). Dow Jones: Price-weighted index of U.S stocks provided by S&P. NASDAQ: Market capitalization index of U.S stocks provided by NASDAQ. Stoxx 600: Market capitalization index of stocks listed in European region. MSCI Asia Ex Japan: Asia excluding Japan equity index provided by MSCI. MSCI EM: Emerging markets equity index provided by MSCI. SSE: Capitalization weighted index of all A-shares and B-shares listed on Shanghai Stock Exchange. STI: Market capitalization index of stocks listed on Singapore Exchange. SREITLSP: Market capitalization index of the most liquid real estate investment trusts in Singapore.
Fixed Income Yield and Returns: All returns represent total return for stated period. Global Aggregate: Global investment grade debt from both developed and emerging markets issuers. U.S. Aggregate, U.S Corporate, High Yield provided by Bloomberg Barclays Indices, ICE Data Services & WSJ. SBIF: ABF Singapore bond index fund provided by Nikko AM.
Key Interest Rates: 2-Year U.S Treasuries, 10 Year Treasuries, Bloomberg. 1-month, 3-month SIBOR: Singapore Interbank Offered Rates provided by Association of Banks in Singapore (ABS). Oil (WTI): Global oil benchmark, Bloomberg. Gold: Gold Spot USD/Oz, Bloomberg. DXY Index: U.S. Dollar Index, Bloomberg. VIX: Expectation of volatility based on S&P index options provided by Chicago Board Options Exchange (CBOE).
The information provided herein is intended for general circulation and/or discussion purposes only. It does not account for the specific investment objectives, financial situation or needs of any individual. The information in this document is not intended to constitute research analysis or recommendation and should not be treated as such.
This does not constitute an offer or solicitation to buy/sell any financial instrument or to participate any investment strategy. No representation or warranty whatsoever (without limiting to accuracy, usefulness, adequacy, timeliness or completeness) in respect of any information (without limiting to any statement, figures, opinion, view or estimate). Syfe does not undertake an obligation to update the information or to correct any inaccuracy that may become apparent at a later time. All information presented is subject to change without notice. Syfe shall not be responsible or liable for any loss or damage whatsoever arising directly or indirectly as a result of any person acting on any information provided herein.
The information provided herein may contain projections or other forward-looking statement regarding future events or future performance of countries, assets, markets or companies. Actual events or results may differ materially. Past performance figures are not necessarily indicative of future of likely performance. Any reference to any specific company, financial product or asset class in whatever way is used for illustrative purposes only and does not constitute a recommendation. Investors should note that there are necessarily limitations and difficulties in using any graph, chart, formula or other device to determine whether or not, or if so, when to, make an investment. The contents hereof are considered proprietary information and may not be produced or disseminated in whole or in part without Syfe’s written consent.

You must be logged in to post a comment.