
Week In Review
Week Ahead
• China Industrial Production (Nov)
• US Retail Sales (Nov)
• The Federal Open Market Committee (FOMC) Meeting
Thought Of The Week
Another week without compromise on stimulus bill in US
The latest weekly initial jobless claims in the US climbed to its highest level since mid-September while continuing claims rose to 5.8 million, above the 5.5 million consensus forecast, after a fresh surge in Covid-19 cases spurred new rounds of shutdowns.
The US Congress continues to talk up the need for some sort of rescue package amidst signs of economic weakness but remains divided on the details of the proposed $916 billion fiscal stimulus bill: 1) State and local government budget support 2) Liability protection for businesses.
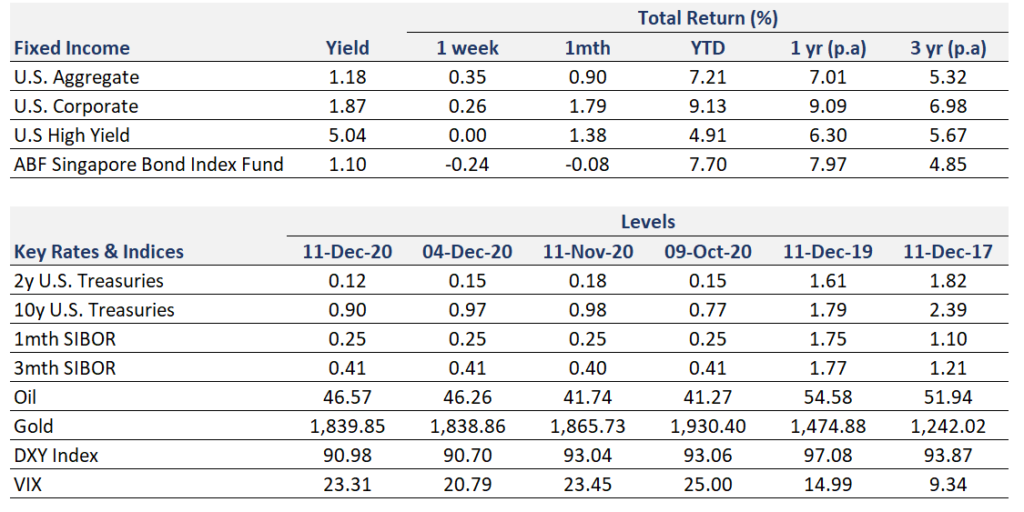
US stocks finished flat this week as investors tried to digest the back-and-forth negotiation since it remains difficult to be meaningfully bearish on this market. On the other hand, the bond market does not seem to be convinced that a stimulus bill is on the cards yet with the 10y US Treasury yield slipping to 0.90%. Congress leaves for its holiday break on 18 Dec.
ECB meets and expands bond-buying programme
The European Central Bank announced that it will be increasing the size of its pandemic emergency purchase programme (PEPP) during their meeting on Thursday. It has pledged to buy €$500 billion more bonds and to finance banks at deeply negative rates (effectively paying them to borrow money) in order to boost confidence in the markets.
The policy decisions were not that surprising – liquidity as needed, monitoring the exchange rate “very carefully” and encouraging lending. However, the effectiveness of these monetary policies remains to be seen since interest rates are currently set at record lows and more government debt is already priced at negative yields, diminishing any impact of the policies to stimulate growth.
The longer-term structural challenges faced by the European Union require fiscal policy and that is the €$750 billion recovery deal that will only be disbursed progressively till 2023.
The battle between Growth and Value stocks
Investors who have been shunning sectors badly affected by the pandemic – financial, industrial and energy, found themselves racing into these laggards last month after positive vaccine news were announced. Given that technology stocks have had a great year, it is no surprise that investors are currently trimming their profits and re-deploying them into beaten down stocks.
This week, Richard Yeh, Head of Portfolio Construction and Risk Management at Syfe, shares his thoughts on the rotation from growth to value stocks and whether there is more to it than meets the eye.
Chart Of The Week
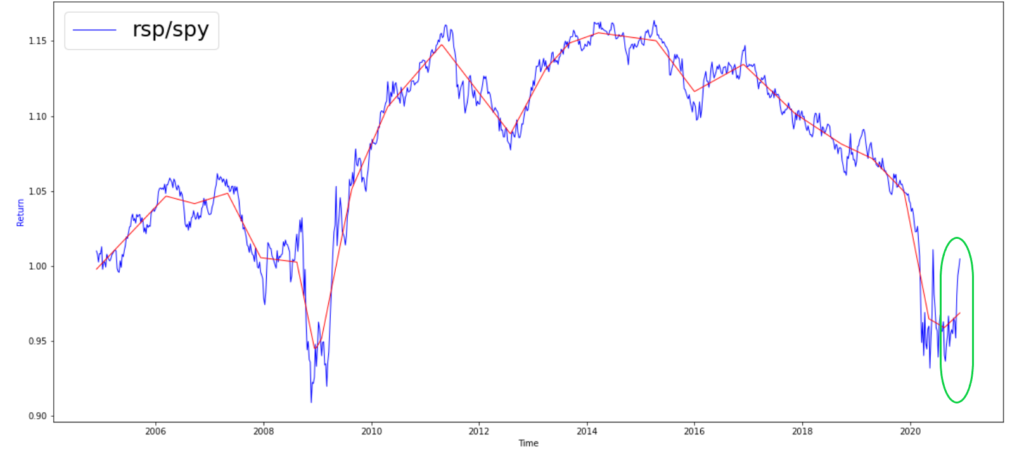
The Invesco S&P 500 Equal Weight ETF (RSP) has outperformed its market capitalization weighted counterpart the SPDR S&P 500 ETF (SPY) in recent months, as shown by the uptrend circled in green. This has largely been driven by the growth of the small-cap factor. For further insights, please click here to read more.
Important Information and Disclosure
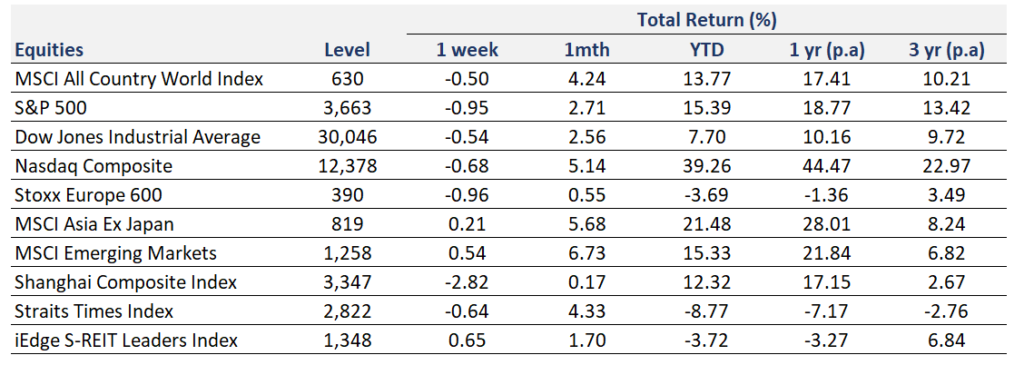
Equity Price Level and Returns: All returns represent the total return for stated period. MSCI ACWI: Global equity index provided by Morgan Stanley Capital International (MSCI). S&P 500: Market capitalization index of U.S stocks provided by Standard & Poor’s (S&P). Dow Jones: Price-weighted index of U.S stocks provided by S&P. NASDAQ: Market capitalization index of U.S stocks provided by NASDAQ. Stoxx 600: Market capitalization index of stocks listed in European region. MSCI Asia Ex Japan: Asia excluding Japan equity index provided by MSCI. MSCI EM: Emerging markets equity index provided by MSCI. SSE: Capitalization weighted index of all A-shares and B-shares listed on Shanghai Stock Exchange. STI: Market capitalization index of stocks listed on Singapore Exchange. SREITLSP: Market capitalization index of the most liquid real estate investment trusts in Singapore.
Fixed Income Yield and Returns: All returns represent total return for stated period. Global Aggregate: Global investment grade debt from both developed and emerging markets issuers. U.S. Aggregate, U.S Corporate, High Yield provided by Bloomberg Barclays Indices, ICE Data Services & WSJ. SBIF: ABF Singapore bond index fund provided by Nikko AM.
Key Interest Rates: 2-Year U.S Treasuries, 10 Year Treasuries, Bloomberg. 1-month, 3-month SIBOR: Singapore Interbank Offered Rates provided by Association of Banks in Singapore (ABS). Oil (WTI): Global oil benchmark, Bloomberg. Gold: Gold Spot USD/Oz, Bloomberg. DXY Index: U.S. Dollar Index, Bloomberg. VIX: Expectation of volatility based on S&P index options provided by Chicago Board Options Exchange (CBOE).
The information provided herein is intended for general circulation and/or discussion purposes only. It does not account for the specific investment objectives, financial situation or needs of any individual. The information in this document is not intended to constitute research analysis or recommendation and should not be treated as such.
This does not constitute an offer or solicitation to buy/sell any financial instrument or to participate any investment strategy. No representation or warranty whatsoever (without limiting to accuracy, usefulness, adequacy, timeliness or completeness) in respect of any information (without limiting to any statement, figures, opinion, view or estimate). Syfe does not undertake an obligation to update the information or to correct any inaccuracy that may become apparent at a later time. All information presented is subject to change without notice. Syfe shall not be responsible or liable for any loss or damage whatsoever arising directly or indirectly as a result of any person acting on any information provided herein.
The information provided herein may contain projections or other forward-looking statement regarding future events or future performance of countries, assets, markets or companies. Actual events or results may differ materially. Past performance figures are not necessarily indicative of future of likely performance. Any reference to any specific company, financial product or asset class in whatever way is used for illustrative purposes only and does not constitute a recommendation. Investors should note that there are necessarily limitations and difficulties in using any graph, chart, formula or other device to determine whether or not, or if so, when to, make an investment. The contents hereof are considered proprietary information and may not be produced or disseminated in whole or in part without Syfe’s written consent.

You must be logged in to post a comment.