
Thought Of The Week
Powell’s Fed Message, Dot Plot, Quadruple Witching
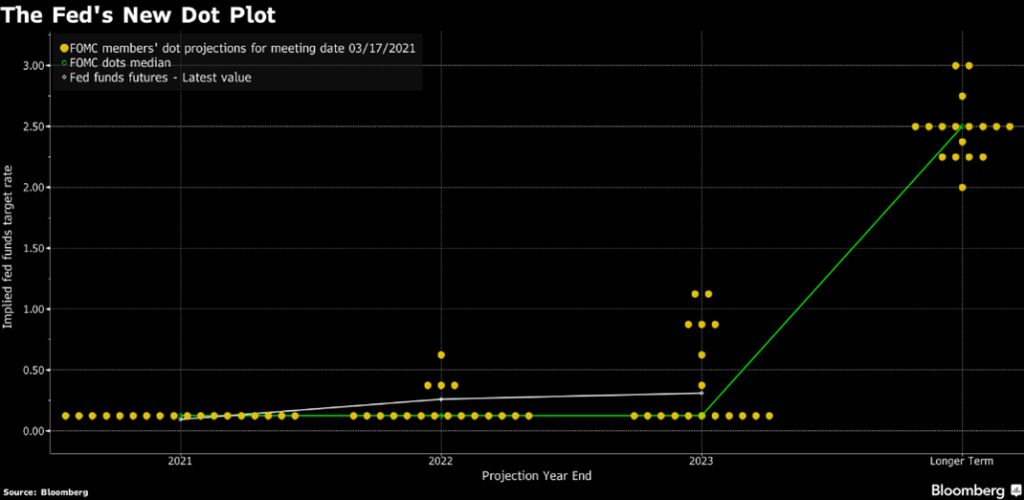
The U.S Federal Reserve did nothing unexpected. Fed Chair Jerome Powell continued to project near-zero interest rates at least through 2023 during its March meeting on Wednesday despite the mounting inflation worries in financial markets. Massive fiscal support and widening vaccinations have buoyed expectations that easy credit will overheat the economy such that rate hikes may need to happen sooner than later. However, Powell, who is not an economist, was not unduly concerned by the rising yields and indicated that the Fed would not use economic forecasts to change policy pre-emptively but would want to see actual data instead. The danger with this approach is that real time data is not necessarily correct.
The new dot plot of interest rate forecasts submitted by each of Fed’s eighteen policy makers also showed seven officials forecasting a rate increase by 2023 although Powell intentionally downplayed the policy signals afterwards and made clear that the guidance resides with him.
Despite the dovishness, Fed officials are growing more upbeat on the economy and upgraded GDP growth forecasts to 6.5% this year, up from a prior projection of 4.2%. Stock markets were relatively flat this week as investors took the chance to recalibrate expectations with quadruple witching on Friday (3rd Friday of every quarter) where all four asset classes – stock index futures, stock index options, stock futures and stock options expired simultaneously.
U.S and China ‘Talk’ in Alaska
The first face-to-face meeting between the U.S and China since Biden administration took place in Alaska on Thursday. The 2-day meeting quickly escalated to a confrontational session with a strong smell of gunpowder as the top diplomats criticized each other over everything from trade to human rights. U.S Secretary of State Antony Blinken accused Beijing of undermining global stability while his counterpart, Yang Jiechi, replied that the U.S was not “qualified to speak to China from a position of strength.” The bickering appeared to be intentional for their domestic consumption on both sides as Biden seeks to display his tough stance on China to his supporters while Xi Jinping needs to satisfy his own increasingly nationalistic population. Following their initial exchange, the delegates had several rounds of closed-door talks although it was unclear if the private discussions were more productive. As the two largest economies strive for a balance between conflict, competition and cooperation, there is a lot more work needed given that the relationship has deteriorated rapidly under Donald Trump.
What is NFT?
NFT stands for non-fungible token. In economics, a fungible asset is something with units that can be readily interchanged – like money and if something is non-fungible, it means that it has unique properties such that it cannot be interchanged with something else, for example, drawings and music. Although they have no tangible form of their own, NFTs are “one-of-a-kind” assets in the digital world which they can be thought of as certificates of ownership for the “original” work. In recent weeks, there have been a lot of excitement around using tech to sell digital art, fuelling multi-million dollars sales. Twitter’s founder Jack Dorsey also hopped on the bandwagon and received $2.5m for his tweet sale. Only time will tell if NFT is a worthless magic bean that is sold for money.
Chart Of The Week
Important Information and Disclosure
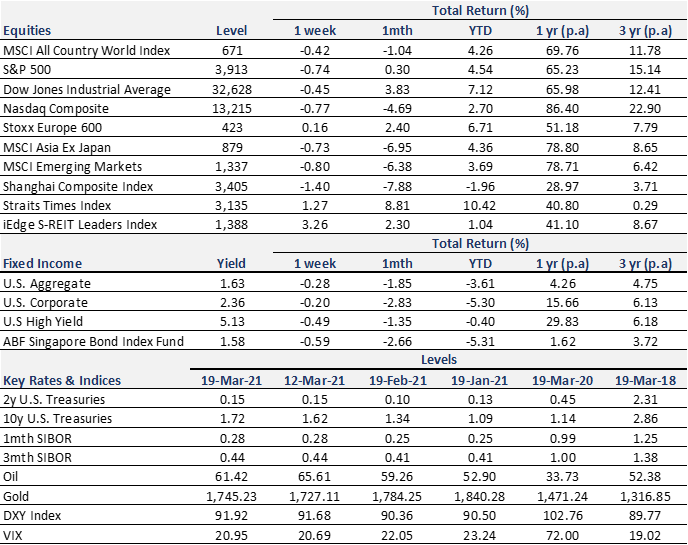
Equity Price Level and Returns: All returns represent the total return for stated period. MSCI ACWI: Global equity index provided by Morgan Stanley Capital International (MSCI). S&P 500: Market capitalization index of U.S stocks provided by Standard & Poor’s (S&P). Dow Jones: Price-weighted index of U.S stocks provided by S&P. NASDAQ: Market capitalization index of U.S stocks provided by NASDAQ. Stoxx 600: Market capitalization index of stocks listed in European region. MSCI Asia Ex Japan: Asia excluding Japan equity index provided by MSCI. MSCI EM: Emerging markets equity index provided by MSCI. SSE: Capitalization weighted index of all A-shares and B-shares listed on Shanghai Stock Exchange. STI: Market capitalization index of stocks listed on Singapore Exchange. SREITLSP: Market capitalization index of the most liquid real estate investment trusts in Singapore.
Fixed Income Yield and Returns: All returns represent total return for stated period. Global Aggregate: Global investment grade debt from both developed and emerging markets issuers. U.S. Aggregate, U.S Corporate, High Yield provided by Bloomberg Barclays Indices, ICE Data Services & WSJ. SBIF: ABF Singapore bond index fund provided by Nikko AM.
Key Interest Rates: 2-Year U.S Treasuries, 10 Year Treasuries, Bloomberg. 1-month, 3-month SIBOR: Singapore Interbank Offered Rates provided by Association of Banks in Singapore (ABS). Oil (WTI): Global oil benchmark, Bloomberg. Gold: Gold Spot USD/Oz, Bloomberg. DXY Index: U.S. Dollar Index, Bloomberg. VIX: Expectation of volatility based on S&P index options provided by Chicago Board Options Exchange (CBOE).
The information provided herein is intended for general circulation and/or discussion purposes only. It does not account for the specific investment objectives, financial situation or needs of any individual. The information in this document is not intended to constitute research analysis or recommendation and should not be treated as such.
This does not constitute an offer or solicitation to buy/sell any financial instrument or to participate any investment strategy. No representation or warranty whatsoever (without limiting to accuracy, usefulness, adequacy, timeliness or completeness) in respect of any information (without limiting to any statement, figures, opinion, view or estimate). Syfe does not undertake an obligation to update the information or to correct any inaccuracy that may become apparent at a later time. All information presented is subject to change without notice. Syfe shall not be responsible or liable for any loss or damage whatsoever arising directly or indirectly as a result of any person acting on any information provided herein.
The information provided herein may contain projections or other forward-looking statement regarding future events or future performance of countries, assets, markets or companies. Actual events or results may differ materially. Past performance figures are not necessarily indicative of future of likely performance. Any reference to any specific company, financial product or asset class in whatever way is used for illustrative purposes only and does not constitute a recommendation. Investors should note that there are necessarily limitations and difficulties in using any graph, chart, formula or other device to determine whether or not, or if so, when to, make an investment. The contents hereof are considered proprietary information and may not be produced or disseminated in whole or in part without Syfe’s written consent.

You must be logged in to post a comment.