
Thought Of The Week
Vaccine Rollout, U.S Jobless Claims, Easing Restrictions on Bank Dividends
The U.S outlook got a boost this week after President Joe Biden doubled the goal for vaccinations to 200 million within his first 100 days during a news conference. U.S fourth quarter GDP was revised higher again while initial jobless claims fell 97,00 to 684,000, recording the best week since the pandemic began. While the good news suggested that the economic recovery is accelerating, it is also stoking concerns about inflation as investors try to position themselves amid the good-news-bad-news narrative.
Meanwhile, the Federal Reserve may be lifting the temporary limits on dividend payments and share buybacks for most banks after June 30, following the completion of annual stress tests to determine their resilience to a hypothetical downturn. The move is a vote of confidence for big banks from the Fed, which initially restricted stock buybacks and capped dividends, citing the need to conserve capital during the pandemic downturn. During the Senate testimony on Wednesday, Janet Yellen commented that “financial institutions look healthier now” and “should have some ability to abiding by the rules to make returns to shareholders.”
Risk appetite also came back in Europe and Asia, capping a volatile week beset with vaccine-supply disputes, a traffic block on the Suez Canal and further deterioration in China’s relations with the West. U.S market indices are mostly up while bond yields have retreated slightly to 1.60%.
Traffic Jam in Suez Canal
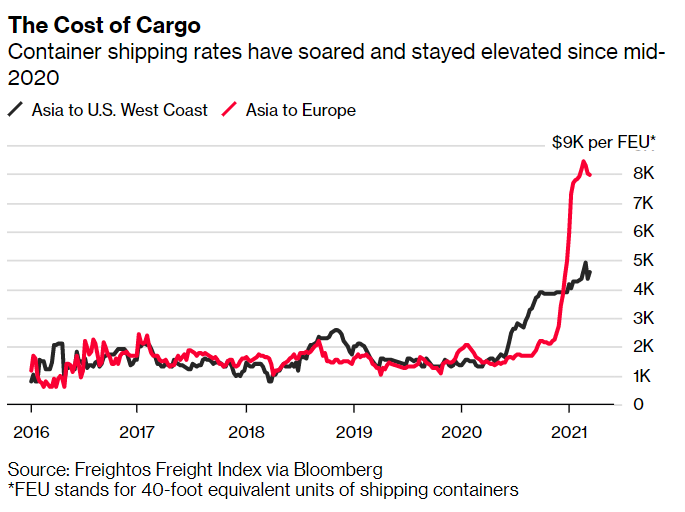
How much is the epic traffic jam in the Suez Canal costing the world? The short answer is: A lot. The Suez Canal is a 193-kilometre man-made waterway that cuts through Egypt to connect the Mediterranean Sea and Red Sea. It is a key transit point for ships moving goods between Asia, Europe and the Eastern U.S and accounts for approximately 12% of world trade, from crude oil to grains to instant coffee. However, the shipping lane became completely blocked when a heavily laden cargo ship, Ever Given, went askew in heavy winds on 23rd March and got itself wedged into the side of the waterway.
The blockage is wreaking further havoc on the global trade network which has been seeing signs of strains due to the pandemic disruption. Shipping rates are surging due to container shortages and detours while the problem compounds each day with vessels that arrived late not being reloaded in time to make the scheduled return journey, leading carriers to cancel trips and further constraining capacity and pushing up freight rates. Rescue efforts had initially been expected to last only a couple of days but will now potentially require more than a week of work. The delay in freeing the ship stuck on the Suez Canal boosted oil, trimming a weekly loss in West Texas Intermediate crude.
Chart Of The Week
Important Information and Disclosure
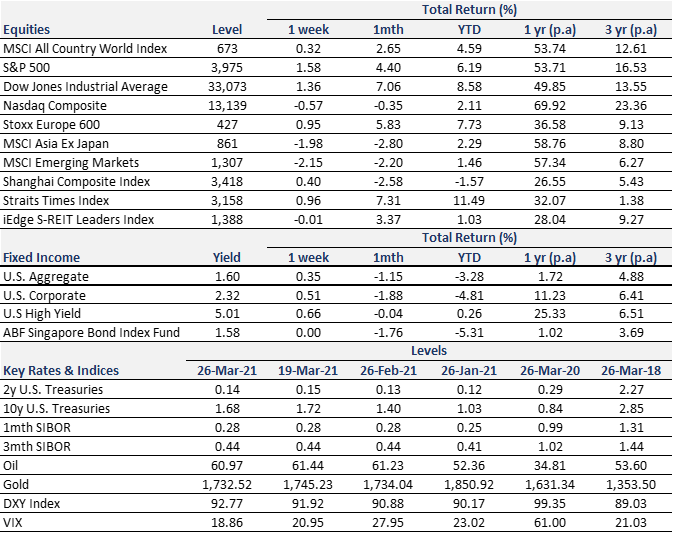
Equity Price Level and Returns: All returns represent the total return for stated period. MSCI ACWI: Global equity index provided by Morgan Stanley Capital International (MSCI). S&P 500: Market capitalization index of U.S stocks provided by Standard & Poor’s (S&P). Dow Jones: Price-weighted index of U.S stocks provided by S&P. NASDAQ: Market capitalization index of U.S stocks provided by NASDAQ. Stoxx 600: Market capitalization index of stocks listed in European region. MSCI Asia Ex Japan: Asia excluding Japan equity index provided by MSCI. MSCI EM: Emerging markets equity index provided by MSCI. SSE: Capitalization weighted index of all A-shares and B-shares listed on Shanghai Stock Exchange. STI: Market capitalization index of stocks listed on Singapore Exchange. SREITLSP: Market capitalization index of the most liquid real estate investment trusts in Singapore.
Fixed Income Yield and Returns: All returns represent total return for stated period. Global Aggregate: Global investment grade debt from both developed and emerging markets issuers. U.S. Aggregate, U.S Corporate, High Yield provided by Bloomberg Barclays Indices, ICE Data Services & WSJ. SBIF: ABF Singapore bond index fund provided by Nikko AM.
Key Interest Rates: 2-Year U.S Treasuries, 10 Year Treasuries, Bloomberg. 1-month, 3-month SIBOR: Singapore Interbank Offered Rates provided by Association of Banks in Singapore (ABS). Oil (WTI): Global oil benchmark, Bloomberg. Gold: Gold Spot USD/Oz, Bloomberg. DXY Index: U.S. Dollar Index, Bloomberg. VIX: Expectation of volatility based on S&P index options provided by Chicago Board Options Exchange (CBOE).
The information provided herein is intended for general circulation and/or discussion purposes only. It does not account for the specific investment objectives, financial situation or needs of any individual. The information in this document is not intended to constitute research analysis or recommendation and should not be treated as such.
This does not constitute an offer or solicitation to buy/sell any financial instrument or to participate any investment strategy. No representation or warranty whatsoever (without limiting to accuracy, usefulness, adequacy, timeliness or completeness) in respect of any information (without limiting to any statement, figures, opinion, view or estimate). Syfe does not undertake an obligation to update the information or to correct any inaccuracy that may become apparent at a later time. All information presented is subject to change without notice. Syfe shall not be responsible or liable for any loss or damage whatsoever arising directly or indirectly as a result of any person acting on any information provided herein.
The information provided herein may contain projections or other forward-looking statement regarding future events or future performance of countries, assets, markets or companies. Actual events or results may differ materially. Past performance figures are not necessarily indicative of future of likely performance. Any reference to any specific company, financial product or asset class in whatever way is used for illustrative purposes only and does not constitute a recommendation. Investors should note that there are necessarily limitations and difficulties in using any graph, chart, formula or other device to determine whether or not, or if so, when to, make an investment. The contents hereof are considered proprietary information and may not be produced or disseminated in whole or in part without Syfe’s written consent.

You must be logged in to post a comment.