
A Tale of Two Markets
The US government bond market experienced further flattening and a partial inversion this week while equity markets ended the week mostly flat after reaching a 2 month high on March 29, 2022. Equity indices retreated in the later part of the week after the latest round of peace talks between Russia and Ukraine stalled. The S&P 500 has recovered 3.7% in March, after entering correction territory in February (falling more than 10% from a peak in January).
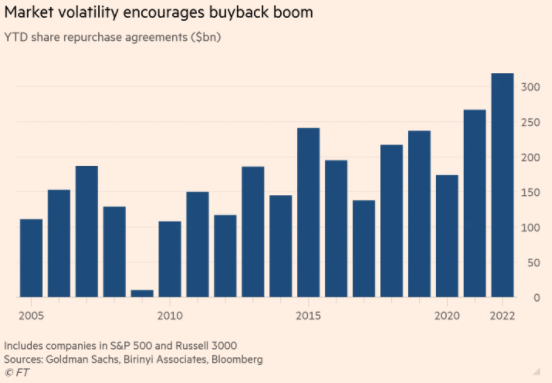
Record Buybacks
Companies across sectors have been continuing their share buyback spree that gained momentum during 2020 in the earlier days of the pandemic. Companies repurchase (or buy back shares) when they think that their own share price is undervalued and to reassure investors during periods of market volatility. According to data from Goldman Sachs, a record $319bn of share buybacks have been authorized this year, as compared to $267bn at the same time last year.
Data the Fed is Watching
Jobs: The US economy added 431,000 jobs in March and the unemployment rate fell from 3.8% in February to 3.6%, while average hourly earnings increased 0.4% on the month. US job vacancies moved back to their second highest level in February, reflecting labor market tightness.
Inflation: The Fed’s preferred inflation gauge (Personal Consumption Expenditures, PCE Index) hit 6.4% in the year through February, up higher from 6.1% a month ago. This did not come as a surprise. Russia’s invasion of Ukraine will show up more clearly in the reading for March. Besides rising energy prices, elevated housing costs and rising wage inflation, it is unlikely that we will see inflationary pressures abate in the next couple of months.
Mortgage applications in the US continued to decline this week to the lowest level since December 2019. The average fixed 30-year mortgage rate increased 30bps to 4.8%, the highest since December 2018. Households across the spectrum have built up savings over the last two years and should be in a good position to weather higher mortgage costs.
Lockdown woes
Chinese PMI data suggest activity moderated in March amid supply chain issues caused by Covid-related restrictions and the impact of geopolitical tensions on international trade. The Caixin and NBS manufacturing PMI readings both dropped below 50 (in contractionary territory) for the first time since February 2020, indicating activity contracted relative to a month prior.
The SEC added Weibo, Baidu, iQIYI, and three other China ADRs during US trading hours to their HFCAA non-compliant list. Several Chinese companies with US ADRs have announced share buybacks, signaling that they believe their shares to be under-valued. For example, Alibaba increased their buyback plan to $25bn from $15bn recently.
Russia to Split Ukraine?
As we enter the second month of war and many false starts at peace talks, we could be looking at a prolonged conflict. Fighting continues as Britain and many other countries send more military aid to Ukraine while Russia holds onto occupied territories.
Markets seem to have calmed down (relatively), with the VIX (fear gauge) lower this week than the week of the invasion. A trio of economists also published a research paper recently looking at volatility of the stock market during peacetime and war time. Somewhat counter-intuitively perhaps, they found that “U.S. stock volatility is 33 percent lower during wartime and periods of conflict”. The explanation proposed was that “the profits of firms become easier to forecast during wartime due to massive government spending”.
Russia is trying to find some support (and buyers) for its currency by asking for natural gas exports to be paid in rubles. Putin’s move has been rejected by European leaders, citing that payments in rubes is not part of the terms of existing contracts.
Earnings Highlights
We covered key market moves here.
What’s Ahead
We are starting to get Q1 2022 earnings from US companies. Large caps (such as Apple, Microsoft, JP Morgan etc.) tend to report in the middle of the earnings cycle.
FOMC meeting minutes will be released next week. FOMC statements explain rationale in policy action and convey the outlook for monetary policy going forward. FOMC minutes are released later, but contain a lot more information. This includes the range of Committee members’ views on the policy stance, US economic outlook and near-term policy inclinations. Market participants are anticipating more details on the plan for balance sheet reduction.
While growth may be held back by persistent inflationary pressures in the short term, investors can take a diversified approach: seeking balance between value and growth, and US and international.
Where could markets go from here?
Rebound in the equity markets this month came as investors realized that the worst-case scenario for the economy has not materialized. Companies and households are entering this next stage of the economic cycle with good fundamentals and strong balance sheets. The path for rate hikes to stall inflation is more or less in line with stock investors’ expectations. Strong employment growth helped maintain the positive momentum in consumer spending even as prices increase. Businesses have been able to pass on the costs to consumers. Companies such as Stabucks and McDonald’s mentioned that they did not see a reduction in demand after raising prices. Tesla raised prices twice this month on inflationary pressures in “raw materials and logistics”. We will see the effects of this price bump on demand and revenue in the upcoming months.
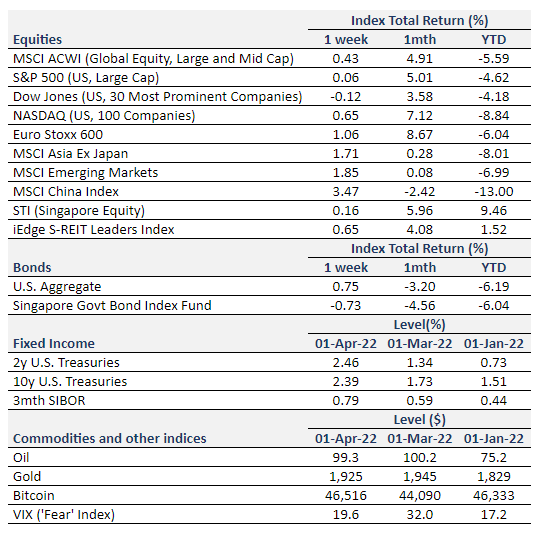
Equity Price Level and Returns: All returns represent the total return for stated period. MSCI ACWI: Global equity index provided by Morgan Stanley Capital International (MSCI). S&P 500: Market capitalization index of U.S stocks provided by Standard & Poor’s (S&P). Dow Jones: Price-weighted index of U.S stocks provided by S&P. NASDAQ: Market capitalization index of U.S stocks provided by NASDAQ. Euro Stoxx 600: Market capitalization index of stocks listed in European region. MSCI Asia Ex Japan: Asia excluding Japan equity index provided by MSCI. MSCI EM: Emerging markets equity index provided by MSCI. SSE: Capitalization weighted index of all A-shares and B-shares listed on Shanghai Stock Exchange. STI: Market capitalization index of stocks listed on Singapore Exchange. SREITLSP: Market capitalization index of the most liquid real estate investment trusts in Singapore.
Fixed Income Yield and Returns: All returns represent total return for stated period. U.S. Aggregate and SBIF from Bloomberg.
Key Interest Rates: 2-Year U.S Treasuries, 10 Year Treasuries, Bloomberg. 3-month SIBOR: Singapore Interbank Offered Rates provided by Association of Banks in Singapore (ABS). Oil (WTI): Global oil benchmark, Bloomberg. Gold: Gold Spot USD/Oz, Bloomberg. Bitcoin/USD, Bloomberg. VIX: Expectation of volatility based on S&P index options provided by Chicago Board Options Exchange (CBOE).
The information provided herein is intended for general circulation and/or discussion purposes only. It does not account for the specific investment objectives, financial situation or needs of any individual. The information in this document is not intended to constitute research analysis or recommendation and should not be treated as such.
This does not constitute an offer or solicitation to buy/sell any financial instrument or to participate any investment strategy. No representation or warranty whatsoever (without limiting to accuracy, usefulness, adequacy, timeliness or completeness) in respect of any information (without limiting to any statement, figures, opinion, view or estimate). Syfe does not undertake an obligation to update the information or to correct any inaccuracy that may become apparent at a later time. All information presented is subject to change without notice. Syfe shall not be responsible or liable for any loss or damage whatsoever arising directly or indirectly as a result of any person acting on any information provided herein.
The information provided herein may contain projections or other forward-looking statement regarding future events or future performance of countries, assets, markets or companies. Actual events or results may differ materially. Past performance figures are not necessarily indicative of future of likely performance. Any reference to any specific company, financial product or asset class in whatever way is used for illustrative purposes only and does not constitute a recommendation. Investors should note that there are necessarily limitations and difficulties in using any graph, chart, formula or other device to determine whether or not, or if so, when to, make an investment. The contents hereof are considered proprietary information and may not be produced or disseminated in whole or in part without Syfe’s written consent.

You must be logged in to post a comment.