
China: a mixed week
Chinese equities gained earlier in the week but ended the week mixed after a statement from the PCAOB (Public Company Accounting Oversight Board) on Thursday mentioned that it would be “premature” to consider issues with several ADRs previously called out to be resolved. This is not unexpected as access and documents have to be provided and due process has to be followed on both sides.
Investors are waiting for more concrete policy actions following Vice Premier Liu He’s speech that buoyed the markets. On March 16 2022, he promised greater support for entities seeking overseas listings and highlighted that US and China regulatory bodies are communicating and have made progress. Investors are also expecting to see concrete actions and plans to bolster the economy through monetary and government policies.
The continued lockdowns in China (Shanghai, Shenzhen, Jilin) could cause a reduction in energy demand in the short term, easing pressure on prices slightly. However, fears of supply chain disruptions increased due to delays in container movements, congestion at ports and higher freight costs.
Stock Markets Shrug Off Possibility of Double Hike at Next Meeting, Nasdaq Records Second Consecutive Week of Gains
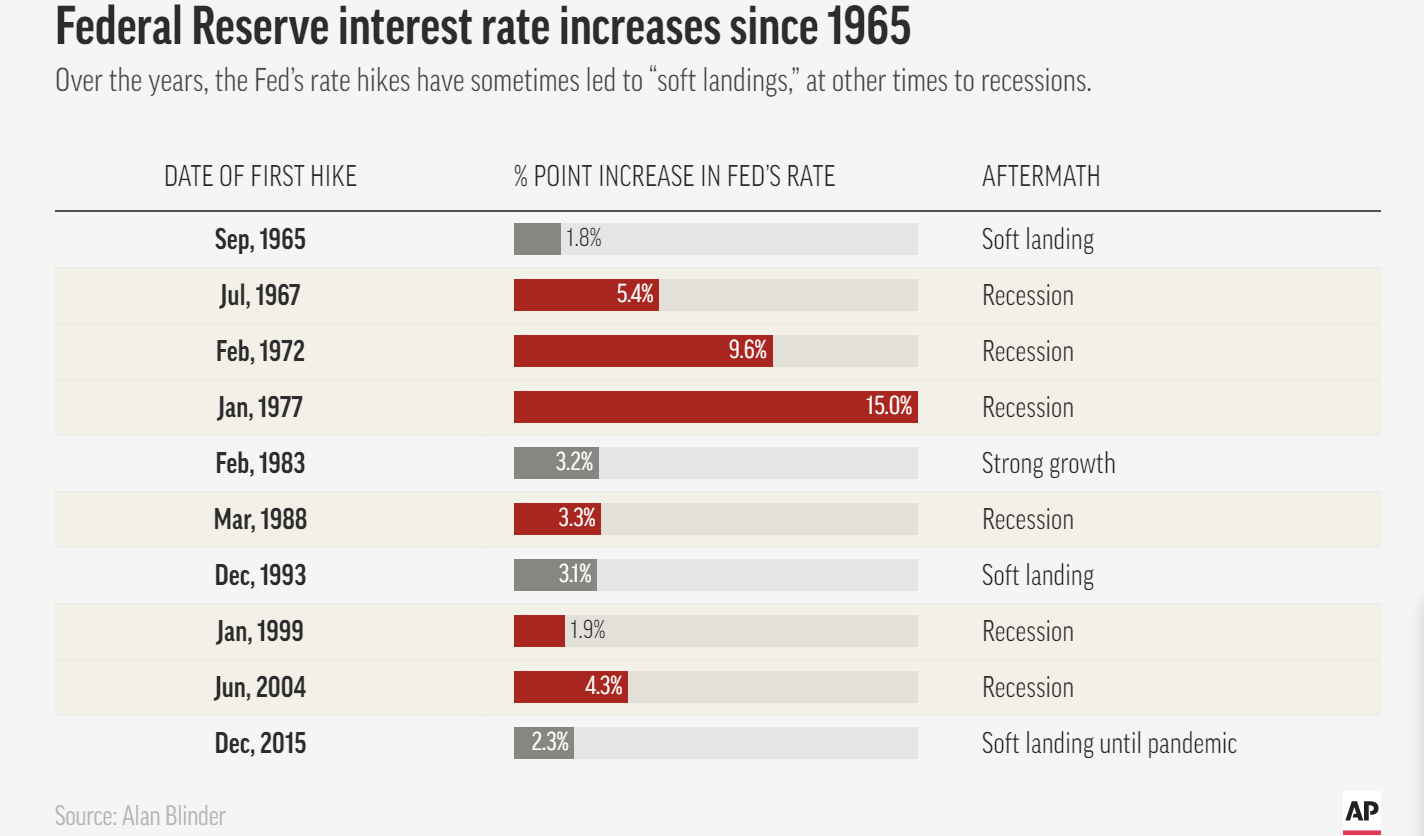
The probability of a 50bps rate hike at the next FOMC meeting increased following Chair Powell’s hawkish comments at the 38th Annual Economic Policy Conference National Association for Business Economics. It also set off a bond sell-off with the 2-year Treasury yield exceeding 2% and the 10-year hitting 2.30%, bringing us closer to yield curve inversion.
Many investors would be aware that every recession of the past 60 years has been preceded by an inverted yield curve. However, not every curve inversion has correctly signaled a recession – there were false positives in the mid 60s and in 2019, where the recession that followed was triggered by a global pandemic.
US Equity markets continued to gain momentum this week, recording a second week of gains, ending the month in the green. When Russia invaded Ukraine slightly over a month ago, the S&P 500 entered correction territory (more than -10%) while the Nasdaq entered a bear market (more than -20%). In the last month, the indices have gained 3.7% and 3.5% respectively.
Do Oil Price Spikes Cause Recessions?
U.S. weekly jobless claims dropped to its lowest level since 1969, signaling the continued strength of the labor market. However, stagflation fears abated slightly but remained elevated. Eric Rosengren (Former President of Federal Reserve Bank of Boston) stated that “the last two recessions were induced by factors other than monetary policy, but the risk of monetary policy being the cause of the next recession has grown”. This concern is most likely shared by Ben Bernanke (who used to be in Powell’s role): oil price spikes do not necessarily cause recessions, but central banks tend to overreact to oil supply shocks and tighten monetary policy too much, pushing the economy into a recession.
Month Two of Russia-Ukraine War
As we enter the second month of war, attacks on Ukraine have turned more brutal with more civilian attacks and shelling, entrenching a sense of stalemate. Global powers may seem to have under-estimated how Ukrainian forces have held up against Russia. Zelenskyy has emphasized that negotiations were the only way to “end this war”, but it takes two hands to clap and peace talks so far have yielded little.
The US has pledged to help Europe ease its dependence on Russian energy by sending more natural gas there. This move will mostly be symbolic as the United States does not have meaningfully sufficient capacity to produce and export more gas, while Europe does not have capacity in the short term to import significantly more. We have seen transatlantic tanker rates surge recently in the attempt to replace Russian crude with US barrels.
Markets seem to have calmed down (relatively), with the VIX (fear gauge) lower this week than the week of the invasion. A trio of economists also published a research paper recently looking at volatility of the stock market during peacetime and war time. Somewhat counter-intuitively perhaps, they found that “U.S. stock volatility is 33 percent lower during wartime and periods of conflict”. The explanation proposed was that “the profits of firms become easier to forecast during wartime due to massive government spending”.
Earnings Highlights
We covered key market moves here.
What’s Ahead
All of S&P 500 companies have reported Q4 20221 earnings. 77% beat EPS (earnings per share estimates while 69% beat revenue estimates according to FactSet.
We are expecting more labor market data next week: with JOLTs job openings and job quits, unemployment and non-farm payrolls. We will also get PCE Price Index Feb readings next week. This is the Fed’s preferred inflation indicator.
We will be watching the US mortgage application rate closely next week too. This will be one of the first data points around consumer behavior post the first rate hike this month. We are already seeing mortgage rates go above 4.5%. The last time mortgage rates hit 5% in 2018, home buying activity receded fairly sharply. Millennials entered the prime home-buying age during the pandemic era where home prices surged, but we are also seeing many (64%) express regrets over their first home purchase. As interest rates increase, mortgage servicing costs will take a larger chunk out of household budgets, potentially stemming consumer spending and easing inflation.
Where could markets go from here?
Wars cause tremendous humanitarian cost. Historically, geopolitical conflict tends to have a relatively short-lived effect on markets before economic drivers take over. However, war on the border of Europe is unprecedented. Investors can take this moment to check that portfolios have sufficient diversification: across asset classes, sectors and countries. Exposure to commodities as a shorter term hedge could be useful too.
The rise in commodity prices and potential supply shocks as a response to the war have ignited fears of stagflation, which last happened more than 40 years ago in a vastly different world. To Chair Powell, “the probability of a recession within the next year is not particularly elevated” as demand is strong, “household and business balance sheets are strong” signaling an economy that is still able to “flourish in the face of less accommodative policy”.
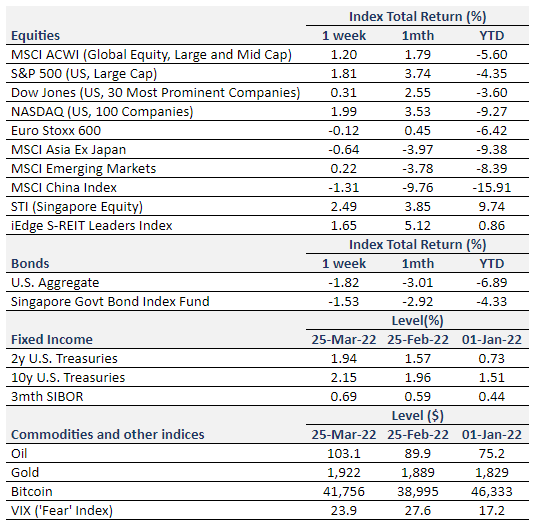
Equity Price Level and Returns: All returns represent the total return for stated period. MSCI ACWI: Global equity index provided by Morgan Stanley Capital International (MSCI). S&P 500: Market capitalization index of U.S stocks provided by Standard & Poor’s (S&P). Dow Jones: Price-weighted index of U.S stocks provided by S&P. NASDAQ: Market capitalization index of U.S stocks provided by NASDAQ. Euro Stoxx 600: Market capitalization index of stocks listed in European region. MSCI Asia Ex Japan: Asia excluding Japan equity index provided by MSCI. MSCI EM: Emerging markets equity index provided by MSCI. SSE: Capitalization weighted index of all A-shares and B-shares listed on Shanghai Stock Exchange. STI: Market capitalization index of stocks listed on Singapore Exchange. SREITLSP: Market capitalization index of the most liquid real estate investment trusts in Singapore.
Fixed Income Yield and Returns: All returns represent total return for stated period. U.S. Aggregate and SBIF from Bloomberg.
Key Interest Rates: 2-Year U.S Treasuries, 10 Year Treasuries, Bloomberg. 3-month SIBOR: Singapore Interbank Offered Rates provided by Association of Banks in Singapore (ABS). Oil (WTI): Global oil benchmark, Bloomberg. Gold: Gold Spot USD/Oz, Bloomberg. Bitcoin/USD, Bloomberg. VIX: Expectation of volatility based on S&P index options provided by Chicago Board Options Exchange (CBOE).
The information provided herein is intended for general circulation and/or discussion purposes only. It does not account for the specific investment objectives, financial situation or needs of any individual. The information in this document is not intended to constitute research analysis or recommendation and should not be treated as such.
This does not constitute an offer or solicitation to buy/sell any financial instrument or to participate any investment strategy. No representation or warranty whatsoever (without limiting to accuracy, usefulness, adequacy, timeliness or completeness) in respect of any information (without limiting to any statement, figures, opinion, view or estimate). Syfe does not undertake an obligation to update the information or to correct any inaccuracy that may become apparent at a later time. All information presented is subject to change without notice. Syfe shall not be responsible or liable for any loss or damage whatsoever arising directly or indirectly as a result of any person acting on any information provided herein.
The information provided herein may contain projections or other forward-looking statement regarding future events or future performance of countries, assets, markets or companies. Actual events or results may differ materially. Past performance figures are not necessarily indicative of future of likely performance. Any reference to any specific company, financial product or asset class in whatever way is used for illustrative purposes only and does not constitute a recommendation. Investors should note that there are necessarily limitations and difficulties in using any graph, chart, formula or other device to determine whether or not, or if so, when to, make an investment. The contents hereof are considered proprietary information and may not be produced or disseminated in whole or in part without Syfe’s written consent.

You must be logged in to post a comment.