
Russia Invades Ukraine
On Thursday (February 24, 2022), President Putin declared the start of a “special military operation” in Ukraine. Heavy shelling and ground fighting were reported in cities and towns across Ukraine. Since then, Moscow’s forces have entered the western areas outside of Kyiv in an attempt to surround the capital. Ukrainians battled for their capital on Friday (Feb 25, 2022) as President Zelensky urged citizens to defend the country as President Putin faced more pressure from the US and European Union (EU).
Investors’ concerns are centered around the invasion, a full out war at the border of the European Union, retaliatory measures from the US, EU and NATO and how this will affect global assets.
Energy Jitters
Putin’s invasion of Ukraine will further squeeze the world oil supply. Brent Crude, one of the most widely traded kinds of oil and one of the main benchmarks of world oil prices surged past $105 before falling back to $97 after President Biden said the United States would work with other countries to release supplies from reserves. Russia is one of the world’s largest oil producers. In the last two years, many countries, including the US and key OPEC have slowed down production. As the pandemic eases, the current supply of oil is unable to meet higher demand. We would expect to see higher oil prices in the short term, leading to higher inflation readings.

Source: Bloomberg, as of Feb 25, 2022. Normalized to 100 (Feb 18, 2022). Russia’s “special military operation” started on Feb 24, 2022.
How Did Markets React to the Invasion and Inflation?
US Equity markets pushed past Russia’s invasion of Ukraine on Thursday and Friday, with the S&P 500 gaining 1.5% and 2.2% respectively. The S&P 500 ended the week flat (+0.1%).
On Friday, we also saw the latest reading from the Fed’s preferred gauge of inflation, the Personal Consumption Expenditures (PCE) Index, which rose 6.1% in 2021, way above the 2.0% target. This was not a surprise and re-affirms that price increases have spread into broader areas. Despite evidence of persistent inflation, stocks gained momentum on Friday after traders pared back expectations that the FOMC will make a double-hike (50bps instead of 25bps) at the next rate setting meeting in March, taking into account the Russian invasion.
US v.s. Europe
The US (through energy, trade and financial channels) is much less directly exposed to Russia as compared to Europe. Only 1% of S&P 500’s revenue is exposed to Russia and Ukraine. Also, roughly 1 in 12 barrels of imported oil comes from Russia.
In contrast, the EU is Russia’s largest trading partner. More than ⅔ of Russian gas exports and more than ½ of oil exports go to Europe.
EU leaders are caught in a tough spot: they want to punish and sanction Russia for invading Ukraine but it is impossible to do so without potentially hurting their own economies too.
So far, the sanctions have been targeted at individual decision makers in Russia and cutting Russia off from Western financial markets, but have left the energy sector mostly unscathed. Germany has suspended the certification process of the already completed Nord Stream 2 natural gas pipeline that runs between Russia and Germany. We await more details on further action from the West and the response from Russia.
War at Europe’s border is uncharted and the human cost will undoubtedly be high. But historically investors have looked past geopolitical conflicts and as we have written here, markets tend to recover quickly.
Earnings Highlights
We covered market moves here and wanted to highlight Alibaba and Coinbase.
Alibaba (BABA) released its Q4 earnings on Thursday, February 24. Alibaba reported its slowest quarterly sales growth since 2014 after being hit by the regulatory headwinds and stiff competition: Pinduoduo (PDD) and JD.com (JD). JD generates more revenue while PDD has more buyers. BABA has fallen more than 36% over the last six months and more than 50% from its peak. BABA remains profitable and many analysts now believe that the stock’s valuation is cheap relative to its fundamentals.
Coinbase (COIN) released earnings on February 24 too, surprising on the upside and the stock price was up 4%. Trading volumes jumped more than ⅔ in Q4 with the rise of retail trading. Altcoins (tokens other than Bitcoin and Ethereum) made up 68% of trading volume in Q4. However, COIN cautions that trading volume is expected to fall in Q1 2022.
Coinbase is diversifying its platform and aims to decouple its stock price moves away from changes in cryptocurrency prices by launching a non-fungible token (NFT) platform.
What’s Ahead
Non Farm Payrolls (NFP), unemployment rate and hourly earnings will be released next Friday. The Fed will be looking at these figures going into the next FOMC meeting in March. Following a strong labor market for the last four months, economists are expecting the growth to continue, expecting the US economy to add 380K new payrolls in February.
Here are companies we are watching next week:
Can Lucid build a better electric vehicle than Tesla?
Lucid Motors (LCID) is set to report quarterly earnings next week. Shares of Lucid have fallen more than 50% from its peak in November 2021 and valuations look more attractive now.
Lucid CEO Peter Rawlinson, along with Eric Bach (Chief Engineer) and Peter Hochholdinger (Head of Manufacturing) were former employees at Tesla under Elon Musk.
The US Environmental Protection Agency (EPA) has rated the range of Lucid Air to be 100 miles longer than the longest-range Tesla on a single charge. As compared to Tesla (TSLA), and Rivian (RIVN), Lucid sells a more expensive and longer range vehicle, potentially giving the company higher profit margins. Lucid started delivering Lucid Air (the flagship) in the last quarter of 2021 and reviews have been positive. Taking a page out of Tesla’s book, Lucid is going directly to consumers through studios and service centers where customers can customize their configuration options through virtual reality.
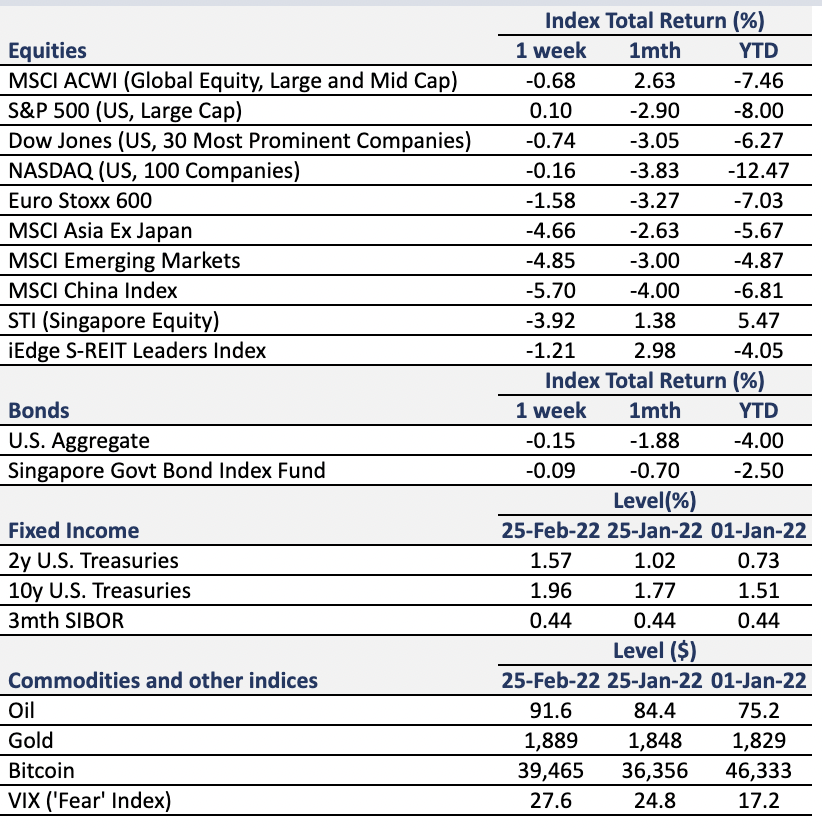
Equity Price Level and Returns: All returns represent the total return for stated period. MSCI ACWI: Global equity index provided by Morgan Stanley Capital International (MSCI). S&P 500: Market capitalization index of U.S stocks provided by Standard & Poor’s (S&P). Dow Jones: Price-weighted index of U.S stocks provided by S&P. NASDAQ: Market capitalization index of U.S stocks provided by NASDAQ. Euro Stoxx 600: Market capitalization index of stocks listed in European region. MSCI Asia Ex Japan: Asia excluding Japan equity index provided by MSCI. MSCI EM: Emerging markets equity index provided by MSCI. SSE: Capitalization weighted index of all A-shares and B-shares listed on Shanghai Stock Exchange. STI: Market capitalization index of stocks listed on Singapore Exchange. SREITLSP: Market capitalization index of the most liquid real estate investment trusts in Singapore.
Fixed Income Yield and Returns: All returns represent total return for stated period. U.S. Aggregate and SBIF from Bloomberg.
Key Interest Rates: 2-Year U.S Treasuries, 10 Year Treasuries, Bloomberg. 3-month SIBOR: Singapore Interbank Offered Rates provided by Association of Banks in Singapore (ABS). Oil (WTI): Global oil benchmark, Bloomberg. Gold: Gold Spot USD/Oz, Bloomberg. Bitcoin/USD, Bloomberg. VIX: Expectation of volatility based on S&P index options provided by Chicago Board Options Exchange (CBOE).
The information provided herein is intended for general circulation and/or discussion purposes only. It does not account for the specific investment objectives, financial situation or needs of any individual. The information in this document is not intended to constitute research analysis or recommendation and should not be treated as such.
This does not constitute an offer or solicitation to buy/sell any financial instrument or to participate any investment strategy. No representation or warranty whatsoever (without limiting to accuracy, usefulness, adequacy, timeliness or completeness) in respect of any information (without limiting to any statement, figures, opinion, view or estimate). Syfe does not undertake an obligation to update the information or to correct any inaccuracy that may become apparent at a later time. All information presented is subject to change without notice. Syfe shall not be responsible or liable for any loss or damage whatsoever arising directly or indirectly as a result of any person acting on any information provided herein.
The information provided herein may contain projections or other forward-looking statement regarding future events or future performance of countries, assets, markets or companies. Actual events or results may differ materially. Past performance figures are not necessarily indicative of future of likely performance. Any reference to any specific company, financial product or asset class in whatever way is used for illustrative purposes only and does not constitute a recommendation. Investors should note that there are necessarily limitations and difficulties in using any graph, chart, formula or other device to determine whether or not, or if so, when to, make an investment. The contents hereof are considered proprietary information and may not be produced or disseminated in whole or in part without Syfe’s written consent.

You must be logged in to post a comment.