

After sliding into a bear market in the first half of the year, the S&P 500 has rebounded about 15% from its mid-June low. The tech-heavy Nasdaq too is up nearly 20% over the same period.
But there are signs the rally could be over for the stock market. Major indices slid into the red this week following days of choppy trading. The S&P 500 broke its four-week winning streak as tech stocks tumbled.
Was the rebound a bear market rally where the market rises swiftly only to tumble down worse than before? Or is this just a minor pullback in a new bull run?
Here’s what to know.
Why did US stocks rally?
Since mid-June, the S&P 500, Nasdaq and Dow have rebounded sharply as investors grew more optimistic that the Federal Reserve could manoeuvre a soft landing. Given the recent spate of positive economic data, it’s starting to look as if the Fed might tame inflation without sending the US economy into a recession.
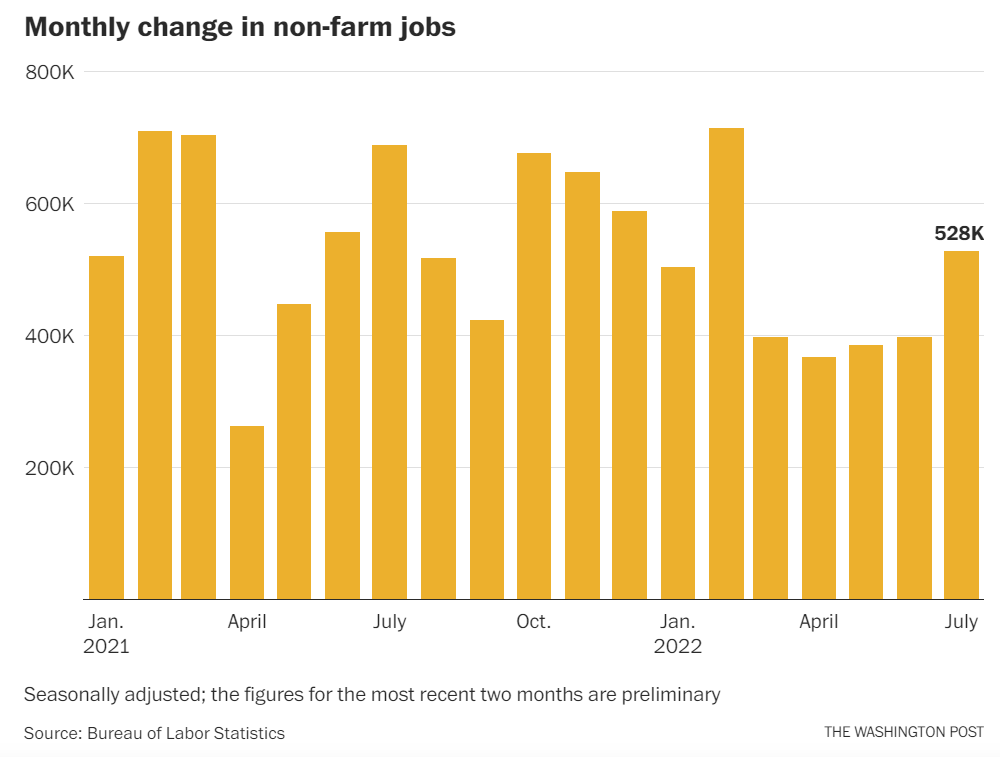
First, the US July jobs report showed surprising strength: 528,000 jobs were added in July while the unemployment rate dropped to 3.5%, the lowest in 50 years.
Second, the US consumer price index rose 8.5% year on year in July, an improvement from June where inflation rose 9.1% from a year earlier.
These factors allayed fears that a recession could be imminent.
At the same time, better-than-expected corporate earnings have helped sustain the stock price momentum. Per Refinitiv data, analysts estimate that S&P 500 companies recorded year on year earnings growth of 9.7% during the second quarter, higher than the 5.6% expected.
Were markets too optimistic?
Although recent data indicates the US economy is still holding up, it also suggests that further rate increases could be well-tolerated without derailing growth.
Given the US economy’s resilience, the Fed may continue on its path of aggressive rate hikes to tame inflation. This week, US stocks edged lower after the Fed’s July meeting minutes showed that board members thought inflation is still “unacceptably high” in the US. The notes make clear that more rate hikes will come, dampening investor sentiment.
Wall Street will be looking ahead to next week’s speech by Fed Chair Jerome Powell at the annual Jackson Hole conference for clues as to when and how much the Fed may hike rates.
A key retracement level suggests the market bottomed out
We don’t know yet if this is a bear market rally. But one technical indicator suggests US stocks bottomed in mid-June.
Last week, the S&P 500 closed above 4,231, thus retracing 50% of its losses from its 3 January high to 16 June low. In other words, the index has recovered half of this year’s loss.
This 50% retracement level has historically signalled the end of a bear market. According to data compiled by CFRA, nearly all previous bear markets have ended when the S&P 500 achieved its 50% retracement. The only exception was the bear market of 1973 which failed the retracement test due to a black swan geopolitical event.
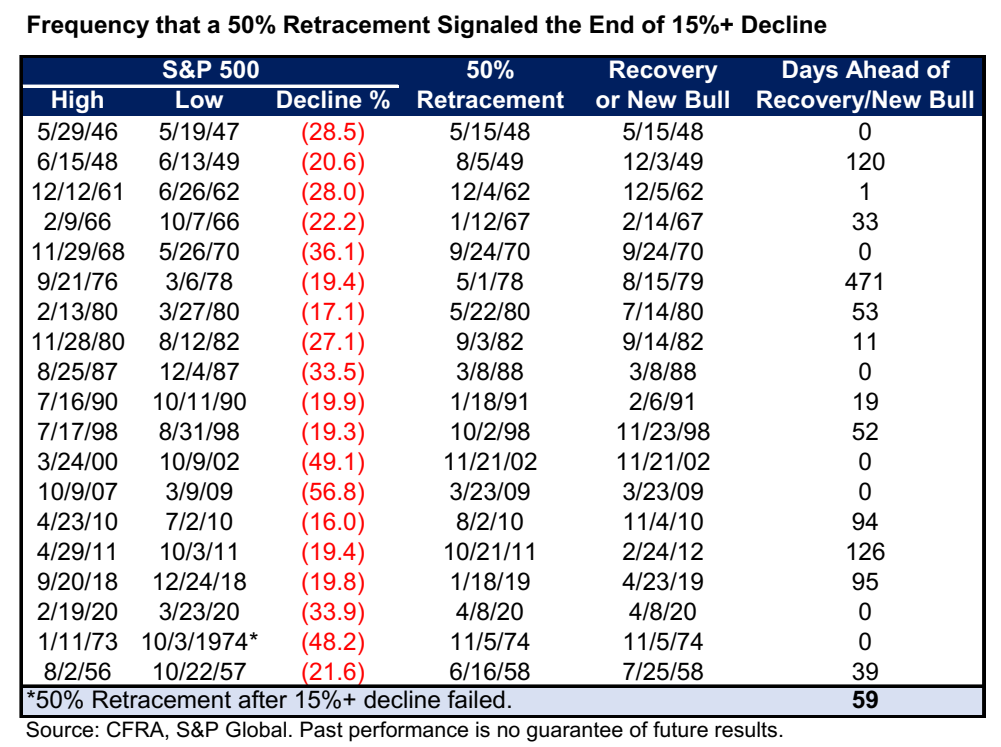
Of course, past performance is no guarantee of future results. But chart patterns suggest that if the stock market resumes its rally, there’s a very good chance that 16 June was the market bottom.
What do the experts say?
Wall Street strategists are divided on whether this is the start of a new bull market, or simply a bear market rally.
In a recent note, JPMorgan analysts posited that the rally could continue to the end of the year, buoyed by the recovery in growth shares as Treasury yields pull back.
“Is the rebound getting overdone and should one go back into value style? Not yet, in our view,” strategist Mislav Matejka argued.
But counterparts at Morgan Stanley disagree.
“The macro, policy and earnings set-up is much less favorable for equities today…The risk/reward is unattractive and this bear market remains incomplete,” noted strategist Michael J. Wilson.
Bank of America is also of the view that stocks could retreat again, according to one key indicator that has a perfect track record of spotting the market bottom. The so-called Rule of 20 says that markets bottom when the sum of the price-to-earnings (P/E) ratio and the consumer price index (CPI) is lower than 20.
Right now, the sum is above 20. The CPI in July rose 8.5% from a year ago and the S&P 500 is trading at a trailing P/E ratio of 21.6, which means the current level is at 30.1.
What to watch out for
Will the bulls win, or will the bears prevail? Ultimately, nobody can accurately predict what’s going to happen next.
But there are key data points that could support – or impact – the stock market’s trajectory heading into 2023.
- Inflation: Will we see a sustained cooling in inflation going forward?
- Fed rate hikes: In July, the Fed raised interest rates by 0.75% for the second straight month. What will be the magnitude of September’s rate hike? How many more rate increases remain?
- Jobs: Can US job growth remain resilient in the coming months? Payrolls remain robust but we are also seeing a small increase in unemployment claims. A robust labour market would put recession fears to rest, but could mean that the Fed will need to continue aggressively hiking interest rates to cool the economy.
- Economic growth: The US economy shrank at an annual rate of 0.9% during the April to June period. In the first quarter, US GDP showed a 1.6% annualised decline. What will the following quarters bring?
- Consumer sentiment: US consumer sentiment brightened more than expected in August. Will consumers continue to stay optimistic about the economy?
Is now the right time to invest in the stock market?
In an uncertain market, it can be tempting to just wait it out on the sidelines.
But research shows that regardless of whether the market is at a high or low point, it’s far better to invest instead of wait.
Let’s take four friends as an example. Three of them invested in an all equity portfolio that tracks the MSCI World Index fund from January 2012 to July 2022 while one held cash.
- ‘Heng’ Henry: Henry has the best timing ever. He invests $10,000 each year at the lowest point.
- ‘Steady’ Stacey: Stacey splits her $10,000 into 12 equal monthly investments. This is also known as dollar-cost averaging (DCA).
- ‘Suay’ Susan: Susan ends up always investing $10,000 at the market highs.
- ‘Kiasi’ Kit: Kit keeps waiting for the “perfect” moment to invest. Because he thinks there’s always a better opportunity, he keeps his $10,000 in cash. (We have used 30-day Treasury Bills as a proxy for cash.)
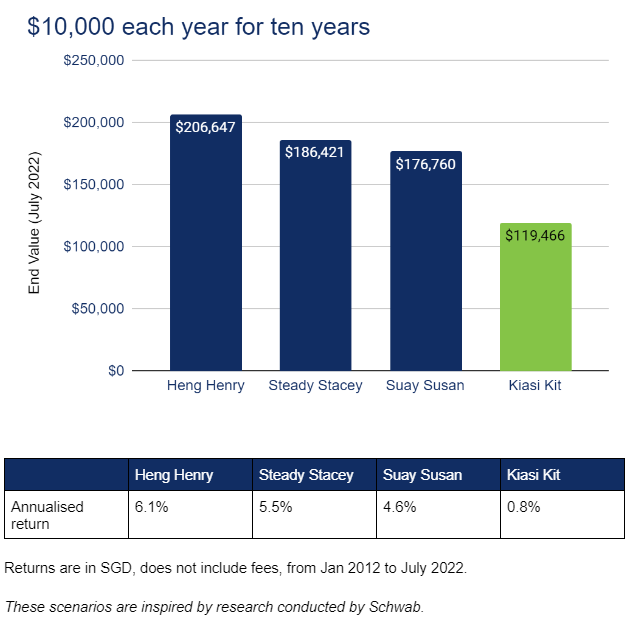
Henry performed the best, but surprisingly, Stacey wasn’t far behind with her dollar cost average approach.
By consistently investing a fixed sum of money over time, Stacey ended up buying more shares when prices were low and fewer shares when prices were high. Over the long term, the cost of her investments averaged out. Dollar cost averaging also helped her to remove some of the risky guesswork involved in trying to time the market.
The key is to invest at the earliest possible moment, no matter what level the market is at. Even Susan, who invested at all-time highs, made considerably more than Kit, who was indecisive and kept his funds in cash.
The takeaway
Bear market rally or not, it’s important to remember that markets do eventually recover.
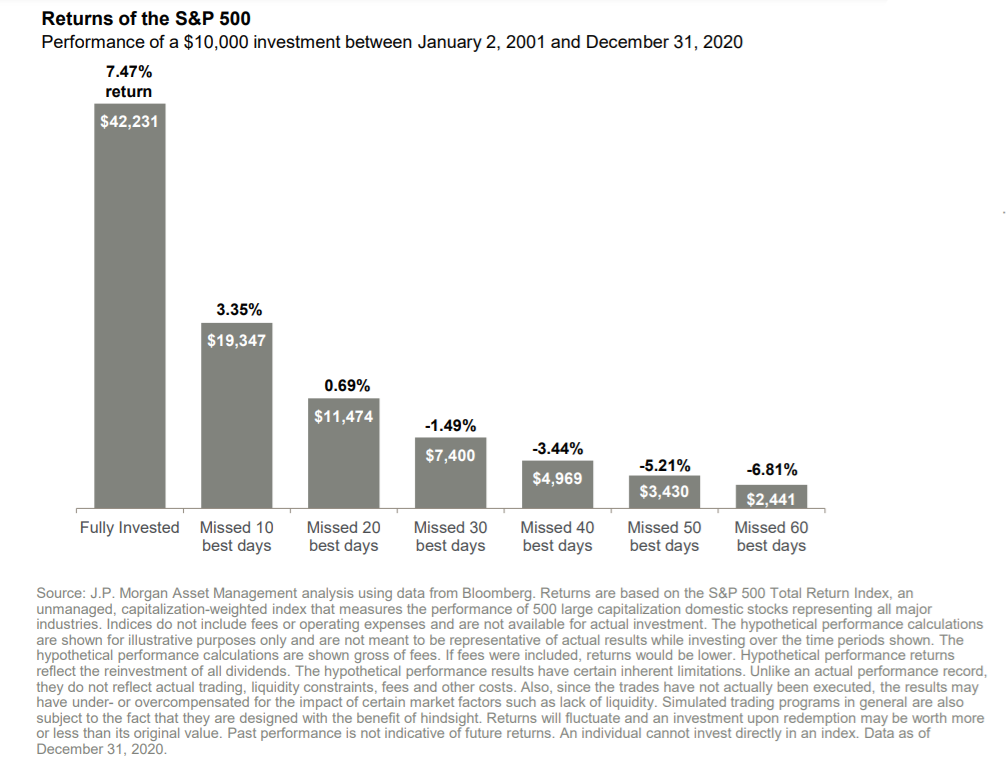
And if you’ve remained committed to your long-term investment strategy so far, kudos! The rebound we saw over the past weeks underscores the importance of staying invested so you can capitalise on the recovery that follows. After all, missing just 10 of the stock market’s best days can cut your overall return by more than 50%, based on research by JPMorgan.
The bottom line? If you want to be a successful long-term investor, consider adopting a dollar cost averaging strategy and staying invested through market ups and downs.
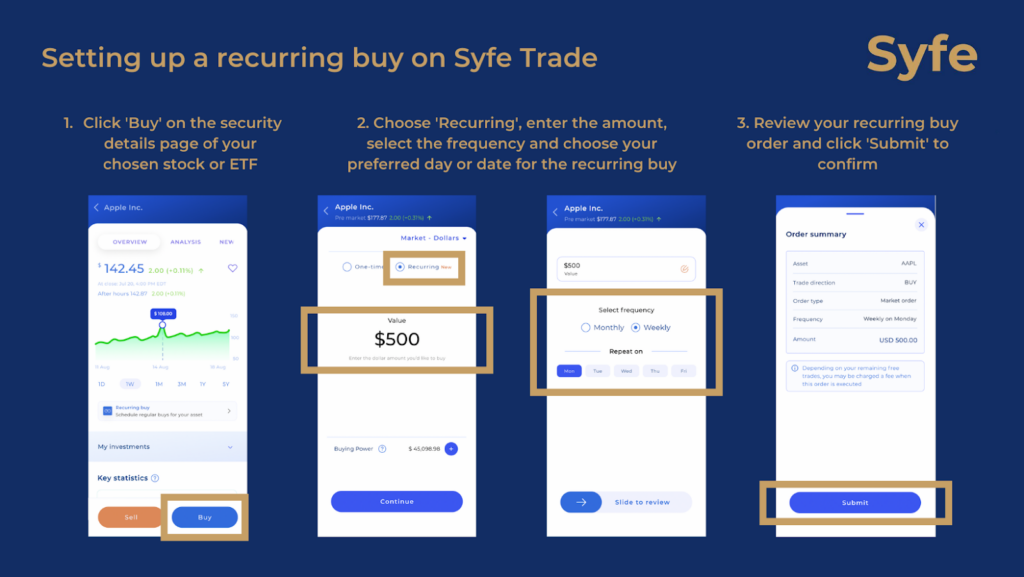
Planning to invest regularly in US stocks and ETFs? You can now do so easily through Syfe Trade’s recurring buy feature! This new feature enables you to automatically invest in a particular stock or ETF every week or month. Just buy the stock as usual and click on the “Recurring” button to enable the feature.

You must be logged in to post a comment.