
“Expeditiously”
Minutes from the March FOMC meeting showed that “many” on the committee are prepared to shrink the balance sheet and raise interest rates “expeditiously” in order to rein in inflation. They were held back from doing so due uncertainty from Russia’s invasion of Ukraine.
Raising interest rates and shrinking the $9 trillion balance sheet would remove support for the economy and increase the cost of borrowing, leading to slower growth, thereby dampening the economy and eventually prices. This chain reaction tends to take some time. If prices remain high and consumers expect persistently higher prices, controlling inflation in such a scenario could be even more difficult.
Fed officials are coalescing around a plan to slow their reinvestment of securities, most likely capping the monthly shrinking at $60 billion for Treasury securities and $35 billion for mortgage-backed debt, twice the rate back in 2017-2019.
Initially, market participants were worried that the Fed was not concerned enough about inflation, as remarks that inflation was “transitory” were still made in late 2021. Now, as the minutes show, the tone has shifted and there are more upside risks to inflation than before, and less nervousness around growth.
China: Lockdown, Supply Chains, and CSRC Helps
Covid-19 cases in China continue to surge, demonstrating that this wave could be more severe than that in early 2020. Disruptions to logistics (truck drivers and port traffic) could be felt globally in an already tight shipping and supply chain situation. A growing number of Chinese cities are requiring freight drivers to take daily P.C.R tests before they can cross municipal borders. Workarounds such as air freight have been attempted, but air freight rates have more than doubled from last year. While Shanghai is still under lockdown, Shenzhen has exited and factories are heading back to full production, fielding some optimism that the worst may be over soon.
It has become less certain that China will be able to meet its 5.5% GDP growth target for the year. Nomura estimates that more than 20 cities are locked-down, affecting more than 200 million residents. Understandably, consumer spending has abated lately due to the restrictions but not it did not come from a turn in consumer sentiment.
Some positive news on the regulatory front: China Securities Regulatory Commission (CSRC), sort of China’s SEC, issued a notice with a proposed rule change that will allow Chinese companies (listed in the US) to inspected onsite by the US Public Company Accounting Oversight Board (PCAOB) and hence be in compliance with the Holding Foreign Companies Accountable Act (HFCAA). This is a step towards reducing the risks of delisting further.
Ruble stages a comeback?
Last week, we wrote that Russia asked to be paid in rubles for its natural gas. This plan was rejected but the ruble has seemingly staged an incredible comeback and is trading at pre-invasion levels, after falling 40%. How did this happen?
As the sanctions have not touched Russian energy exports directly, along with the increase in oil and gas prices and Russia’s strong relationships with huge economies like India and China, there has still been a steady flow of foreign currency into Russia. This helps Russia build a current account surplus, achieved as Russia exports more than it imports. Additionally, Russia has raised its interest rates to 20% and instituted strict capital controls such as demanding that Russian businesses convert 80% of overseas revenue into rubles, creating support levels for the ruble.
Despite the financial sanctions and the latest round of targeted sanctions against Putin, Russia is unlikely to become insolvent. If Putin is able to force many nations that import Russian gas to pay for it in rubles (terms of existing contracts will have to be re-negotiated for this to happen), demand for the currency will increase further and its market value will be higher as well. That being said, if Putin pushes this point too hard, Russia could risk reducing the revenue stream from energy exports.
Earnings Highlights
We covered key market moves here.
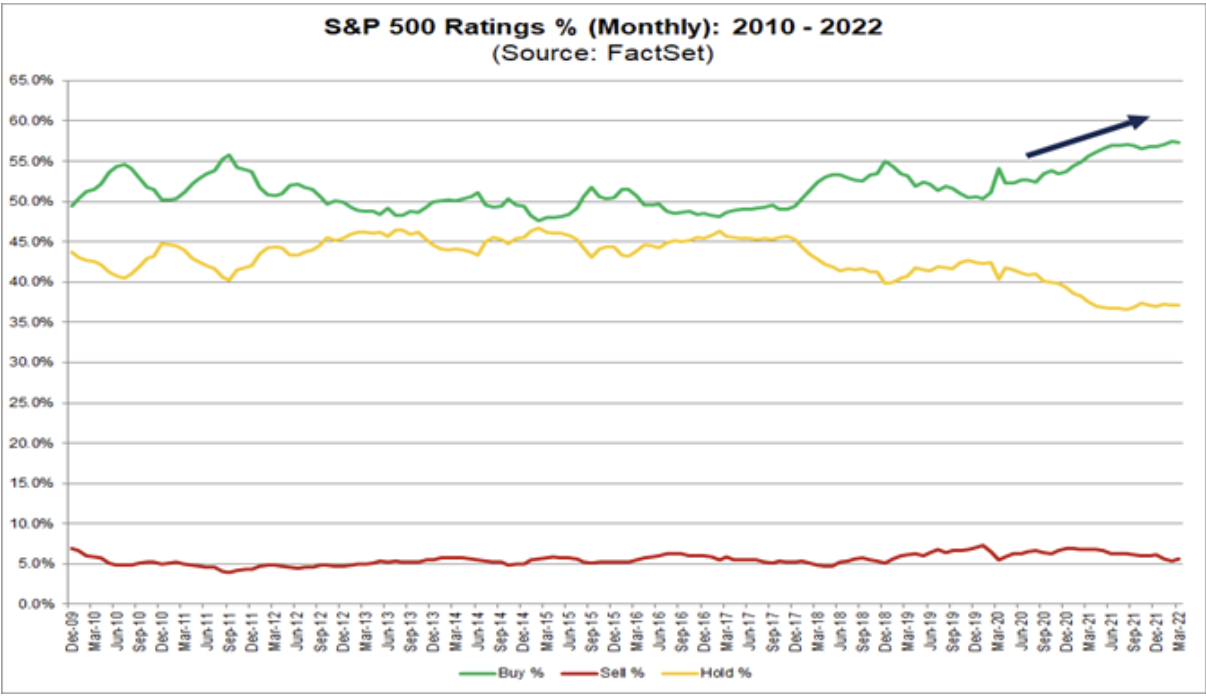
Also, according to research from FactSet, analysts have the most “buy” ratings on S&P 500 stocks since 2010. 57.3% of the S&P 500 stocks are buy-rated. The last time the percentage of Buy ratings exceeded 55% at the end of a month was September 2011. There are sector differences: analysts are most bullish on Energy, Technology and Communication Services (all above 60%) and least bullish on Utilities (49%) and Consumer Staples (49%).
What has been driving this? Bottom-up analyst EPS (earnings per share) estimates mainly. EPS estimates are expected to increase over the next few quarters as the world recovers from Covid-19 pandemic. It is perhaps worth pointing out that the bottom-up estimates for Q1 2022 decreased and the S&P 500 declined during the same time period. With the fall in stock prices in Q1 2022, the forward 12 month P/E (Price to Earnings) ratio fell to 19.5 from 21.3, signaling that US stocks are less over-valued than before.
What’s Ahead
We are starting to get Q1 2022 earnings from the large-caps. The spotlight will be on banks this week: JP Morgan (JPM), Goldman Sachs (GS), BlackRock (BLK). It will be a short week next week due to Good Friday but there will be a number of key data points released: Consumer sentiment, retail sales figures, March CPI.
The next Fed meeting will be on May 3, 2022, happening before we get the April figure . A higher-than-expected inflation reading may cause the market to anticipate a double hike (50bps at a go, instead of 25bps over two meetings).
Where could markets go from here?
Recent recovery in the equity markets came as investors realized that the worst-case scenario for the economy has not materialized. Companies and households are entering this next stage of the economic cycle with good fundamentals and strong balance sheets. We do see a divergence in expectations from bond and equity investors: where the former appears less optimistic.
While growth may be held back by persistent inflationary pressures in the short term, investors can take a diversified approach: seeking balance between value and growth, and US and international.
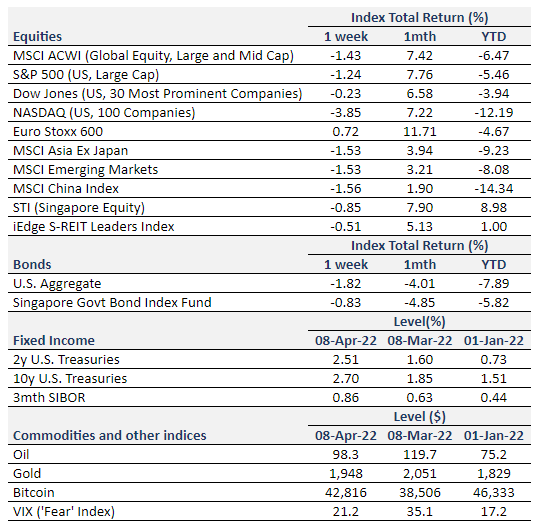
Equity Price Level and Returns: All returns represent the total return for stated period. MSCI ACWI: Global equity index provided by Morgan Stanley Capital International (MSCI). S&P 500: Market capitalization index of U.S stocks provided by Standard & Poor’s (S&P). Dow Jones: Price-weighted index of U.S stocks provided by S&P. NASDAQ: Market capitalization index of U.S stocks provided by NASDAQ. Euro Stoxx 600: Market capitalization index of stocks listed in European region. MSCI Asia Ex Japan: Asia excluding Japan equity index provided by MSCI. MSCI EM: Emerging markets equity index provided by MSCI. SSE: Capitalization weighted index of all A-shares and B-shares listed on Shanghai Stock Exchange. STI: Market capitalization index of stocks listed on Singapore Exchange. SREITLSP: Market capitalization index of the most liquid real estate investment trusts in Singapore.
Fixed Income Yield and Returns: All returns represent total return for stated period. U.S. Aggregate and SBIF from Bloomberg.
Key Interest Rates: 2-Year U.S Treasuries, 10 Year Treasuries, Bloomberg. 3-month SIBOR: Singapore Interbank Offered Rates provided by Association of Banks in Singapore (ABS). Oil (WTI): Global oil benchmark, Bloomberg. Gold: Gold Spot USD/Oz, Bloomberg. Bitcoin/USD, Bloomberg. VIX: Expectation of volatility based on S&P index options provided by Chicago Board Options Exchange (CBOE).
The information provided herein is intended for general circulation and/or discussion purposes only. It does not account for the specific investment objectives, financial situation or needs of any individual. The information in this document is not intended to constitute research analysis or recommendation and should not be treated as such.
This does not constitute an offer or solicitation to buy/sell any financial instrument or to participate any investment strategy. No representation or warranty whatsoever (without limiting to accuracy, usefulness, adequacy, timeliness or completeness) in respect of any information (without limiting to any statement, figures, opinion, view or estimate). Syfe does not undertake an obligation to update the information or to correct any inaccuracy that may become apparent at a later time. All information presented is subject to change without notice. Syfe shall not be responsible or liable for any loss or damage whatsoever arising directly or indirectly as a result of any person acting on any information provided herein.
The information provided herein may contain projections or other forward-looking statement regarding future events or future performance of countries, assets, markets or companies. Actual events or results may differ materially. Past performance figures are not necessarily indicative of future of likely performance. Any reference to any specific company, financial product or asset class in whatever way is used for illustrative purposes only and does not constitute a recommendation. Investors should note that there are necessarily limitations and difficulties in using any graph, chart, formula or other device to determine whether or not, or if so, when to, make an investment. The contents hereof are considered proprietary information and may not be produced or disseminated in whole or in part without Syfe’s written consent.

You must be logged in to post a comment.